High data traffic from MySQL server to web server
1
vote
1
answer
1124
views
I have one webserver running Magento : Community Edition 1.7.0.2 and a separate machine with MySQL 5.5.42 on it.
Both machines are EC2 instances.
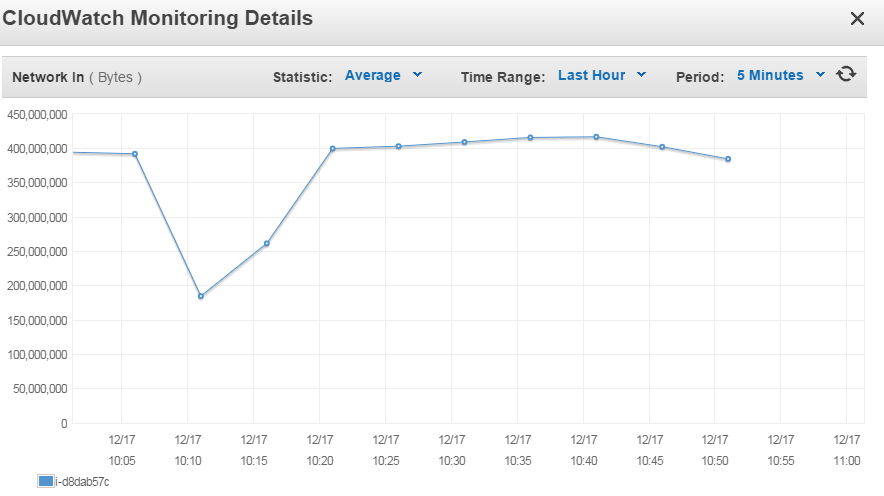
I am seeing huge unexpected data traffic from the MySQL server to the web server - approximately 400 Mbps for (mostly) an hour which completely occupies the CPU of the web server. There also seems to be a mismatch between the data reported by CloudWatch and IPTraf.
We're trying to diagnose the issue - what can I run which will help identify why this is happening?
Observations:
1. As per CloudWatch, the Magento webserver seems to receive 400MBps of data (at certain times) - screenshot 1
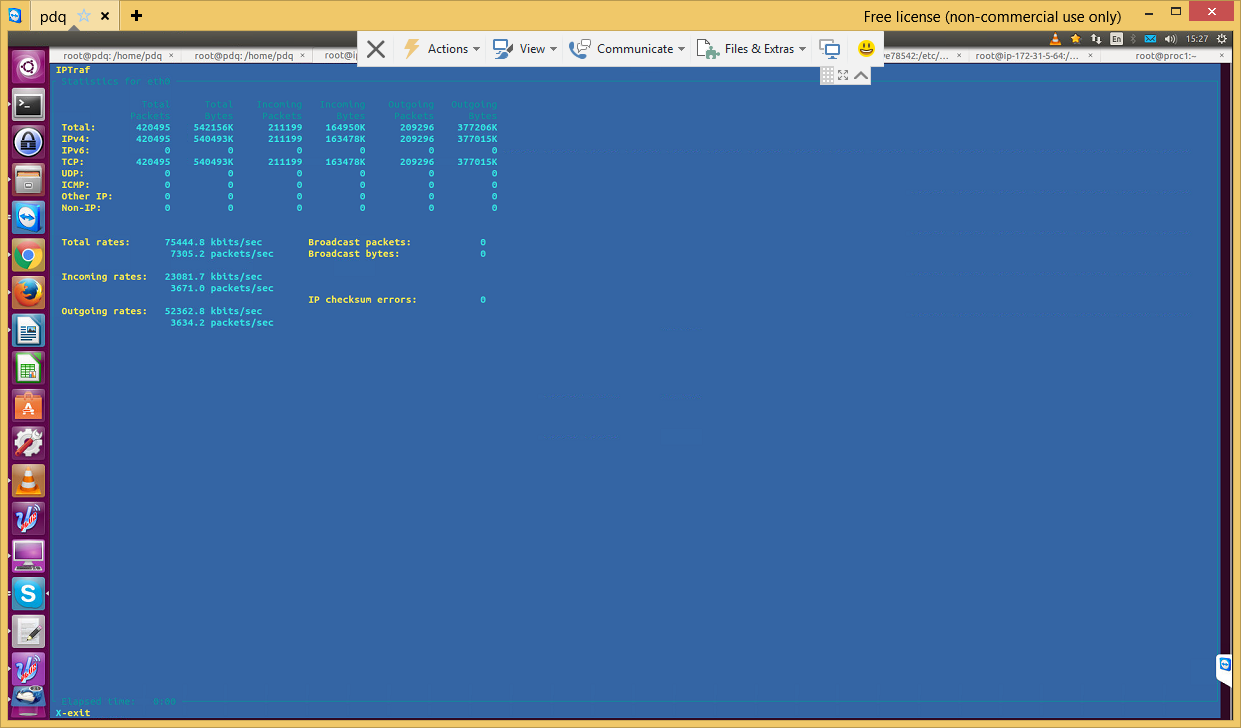
2. As per IPTraf, the Magento webserver seems to receive only 50MBps - screenshot 2
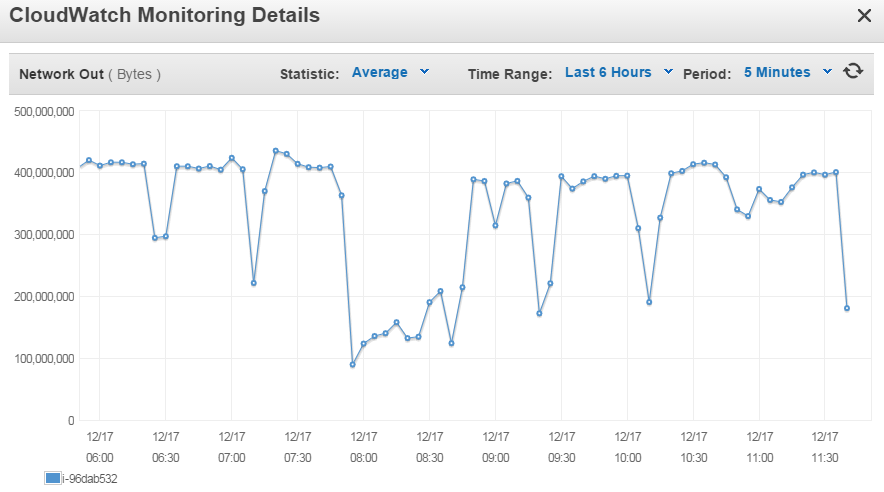
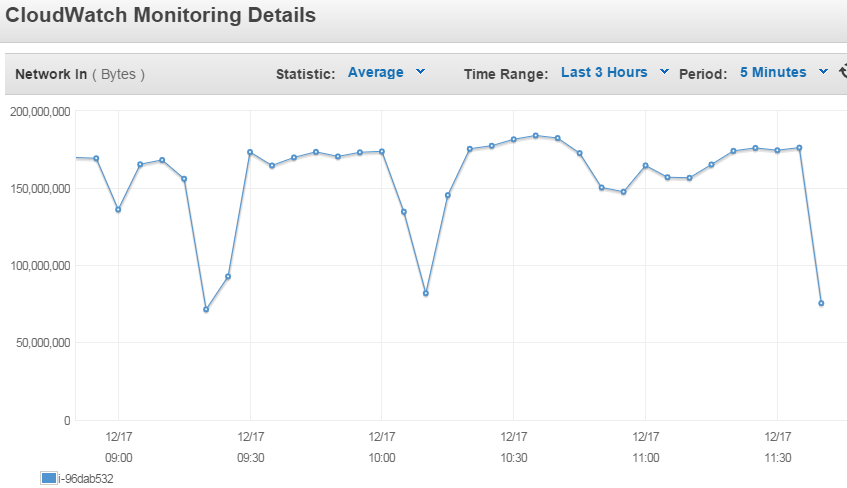
3. As per CloudWatch, the MySQL webserver seems to send 400MBps of data (at certain times) - screenshot 3
Screenshot 1
 Screenshot 2
 Screenshot 3
 Others:
 EDIT1
During the high data traffic to the webserver, the htop output is as follows (on the MySQL server):
(I think very temporarily it shows up as high CPU usage)
EDIT1
During the high data traffic to the webserver, the htop output is as follows (on the MySQL server):
(I think very temporarily it shows up as high CPU usage)
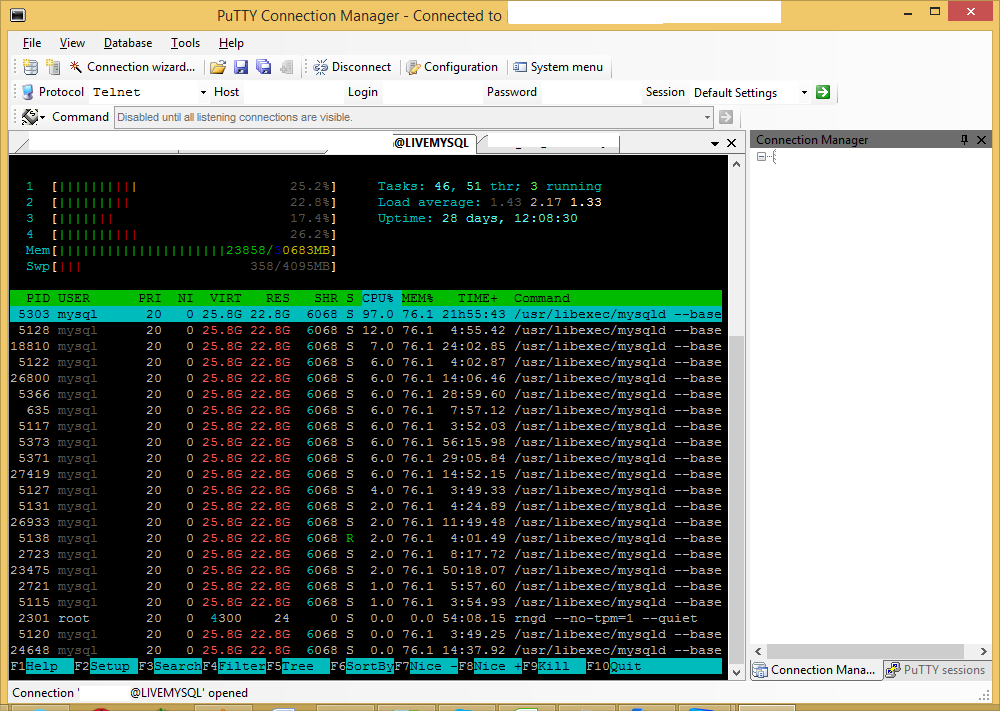
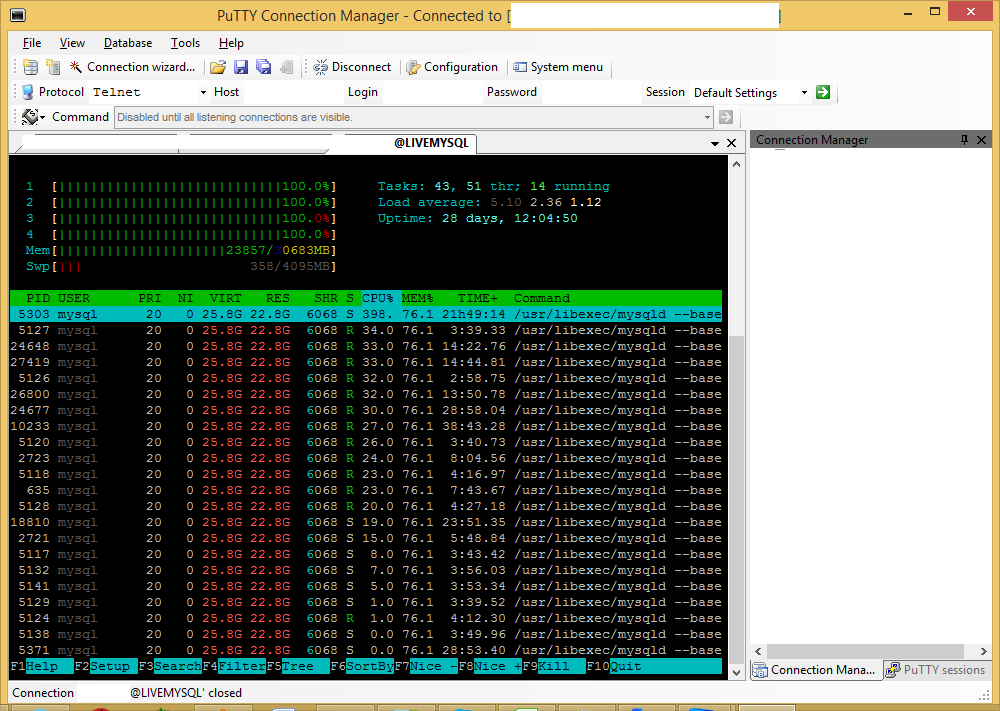 Mostly it's like this:
 EDIT2:
top command output on MySQL server while high CPU load on web server
top - 00:08:54 up 28 days, 23:46, 2 users, load average: 0.07, 0.06, 0.07
Tasks: 97 total, 1 running, 96 sleeping, 0 stopped, 0 zombie
Cpu(s): 11.2%us, 1.2%sy, 0.0%ni, 86.8%id, 0.6%wa, 0.0%hi, 0.2%si, 0.1%st
Mem: 31420088k total, 30966400k used, 453688k free, 166384k buffers
Swap: 4194300k total, 61328k used, 4132972k free, 8084828k cached
PID USER PR NI VIRT RES SHR S %CPU %MEM TIME+ COMMAND
13387 mysql 20 0 25.6g 21g 6884 S 17.9 70.5 263:34.95 mysqld
1 root 20 0 19596 1068 828 S 0.0 0.0 0:02.09 init
2 root 20 0 0 0 0 S 0.0 0.0 0:00.01 kthreadd
3 root 20 0 0 0 0 S 0.0 0.0 0:13.48 ksoftirqd/0
5 root 0 -20 0 0 0 S 0.0 0.0 0:00.00 kworker/0:0H
7 root 20 0 0 0 0 S 0.0 0.0 20:42.18 rcu_sched
8 root 20 0 0 0 0 S 0.0 0.0 0:00.00 rcu_bh
9 root RT 0 0 0 0 S 0.0 0.0 0:00.54 migration/0
10 root RT 0 0 0 0 S 0.0 0.0 0:00.46 migration/1
11 root 20 0 0 0 0 S 0.0 0.0 0:44.45 ksoftirqd/1
13 root 0 -20 0 0 0 S 0.0 0.0 0:00.00 kworker/1:0H
14 root RT 0 0 0 0 S 0.0 0.0 0:01.48 migration/2
15 root 20 0 0 0 0 S 0.0 0.0 0:44.13 ksoftirqd/2
17 root 0 -20 0 0 0 S 0.0 0.0 0:00.00 kworker/2:0H
18 root RT 0 0 0 0 S 0.0 0.0 0:01.44 migration/3
19 root 20 0 0 0 0 S 0.0 0.0 0:12.68 ksoftirqd/3
21 root 0 -20 0 0 0 S 0.0 0.0 0:00.00 kworker/3:0H
22 root 0 -20 0 0 0 S 0.0 0.0 0:00.00 khelper
23 root 20 0 0 0 0 S 0.0 0.0 0:00.00 kdevtmpfs
24 root 0 -20 0 0 0 S 0.0 0.0 0:00.00 netns
31 root 20 0 0 0 0 S 0.0 0.0 0:00.04 xenwatch
32 root 20 0 0 0 0 S 0.0 0.0 0:00.00 xenbus
130 root 0 -20 0 0 0 S 0.0 0.0 0:00.00 writeback
133 root 25 5 0 0 0 S 0.0 0.0 0:00.00 ksmd
134 root 39 19 0 0 0 S 0.0 0.0 0:00.00 khugepaged
135 root 0 -20 0 0 0 S 0.0 0.0 0:00.00 kintegrityd
EDIT3
I ran the following (during the heavy traffic phase) to track the MySQL processes, but there was nothing amiss in the results. The queries mentioned were all "fine" - nothing which could explain this really odd behavior.
mysqladmin -u DATABASEUSER -p -hIPADDRESS -i 1 --verbose processlist > /tmp/mysql-processlist3.txt
Have a look at the initial output (which WAS during the heavy traffic phase). Edited to remove redundancy.
+--------+--------------+-------------------+---------------+---------+------+-------+-----------------------+
| Id | User | Host | db | Command | Time | State | Info |
+--------+--------------+-------------------+---------------+---------+------+-------+-----------------------+
| 113267 | DATABASEUSER | IPADDRESS_1:55847 | DATABASE_NAME | Sleep | 12 | | |
| 113297 | DATABASEUSER | IPADDRESS_1:55942 | DATABASE_NAME | Sleep | 0 | | |
...
| 113310 | DATABASEUSER | IPADDRESS_1:55978 | DATABASE_NAME | Sleep | 0 | | |
| 113311 | DATABASEUSER | IPADDRESS_1:55982 | | Query | 0 | | show full processlist |
+--------+--------------+-------------------+---------------+---------+------+-------+-----------------------+
+--------+--------------+-------------------+---------------+---------+------+-------+-----------------------+
| Id | User | Host | db | Command | Time | State | Info |
+--------+--------------+-------------------+---------------+---------+------+-------+-----------------------+
| 113267 | DATABASEUSER | IPADDRESS_1:55847 | DATABASE_NAME | Sleep | 13 | | |
| 113301 | DATABASEUSER | IPADDRESS_1:55952 | DATABASE_NAME | Sleep | 0 | | |
...
| 113310 | DATABASEUSER | IPADDRESS_1:55978 | DATABASE_NAME | Sleep | 0 | | |
| 113311 | DATABASEUSER | IPADDRESS_1:55982 | | Query | 0 | | show full processlist |
| 113312 | DATABASEUSER | IPADDRESS_1:55985 | DATABASE_NAME | Sleep | 0 | | |
...
+--------+--------------+-------------------+---------------+---------+------+-------+-----------------------+
...
9 such instances (as above)
...
+--------+--------------+-------------------+---------------+---------+------+----------+----------------------------------------------------------------------+
| Id | User | Host | db | Command | Time | State | Info |
+--------+--------------+-------------------+---------------+---------+------+----------+----------------------------------------------------------------------+
| 113267 | DATABASEUSER | IPADDRESS_1:55847 | DATABASE_NAME | Sleep | 23 | | |
| 113311 | DATABASEUSER | IPADDRESS_1:55982 | | Query | 0 | | show full processlist |
| 113333 | DATABASEUSER | IPADDRESS_1:56047 | DATABASE_NAME | Sleep | 0 | | |
| 113334 | DATABASEUSER | IPADDRESS_1:56050 | DATABASE_NAME | Query | 0 | updating | DELETE FROM
EDIT2:
top command output on MySQL server while high CPU load on web server
top - 00:08:54 up 28 days, 23:46, 2 users, load average: 0.07, 0.06, 0.07
Tasks: 97 total, 1 running, 96 sleeping, 0 stopped, 0 zombie
Cpu(s): 11.2%us, 1.2%sy, 0.0%ni, 86.8%id, 0.6%wa, 0.0%hi, 0.2%si, 0.1%st
Mem: 31420088k total, 30966400k used, 453688k free, 166384k buffers
Swap: 4194300k total, 61328k used, 4132972k free, 8084828k cached
PID USER PR NI VIRT RES SHR S %CPU %MEM TIME+ COMMAND
13387 mysql 20 0 25.6g 21g 6884 S 17.9 70.5 263:34.95 mysqld
1 root 20 0 19596 1068 828 S 0.0 0.0 0:02.09 init
2 root 20 0 0 0 0 S 0.0 0.0 0:00.01 kthreadd
3 root 20 0 0 0 0 S 0.0 0.0 0:13.48 ksoftirqd/0
5 root 0 -20 0 0 0 S 0.0 0.0 0:00.00 kworker/0:0H
7 root 20 0 0 0 0 S 0.0 0.0 20:42.18 rcu_sched
8 root 20 0 0 0 0 S 0.0 0.0 0:00.00 rcu_bh
9 root RT 0 0 0 0 S 0.0 0.0 0:00.54 migration/0
10 root RT 0 0 0 0 S 0.0 0.0 0:00.46 migration/1
11 root 20 0 0 0 0 S 0.0 0.0 0:44.45 ksoftirqd/1
13 root 0 -20 0 0 0 S 0.0 0.0 0:00.00 kworker/1:0H
14 root RT 0 0 0 0 S 0.0 0.0 0:01.48 migration/2
15 root 20 0 0 0 0 S 0.0 0.0 0:44.13 ksoftirqd/2
17 root 0 -20 0 0 0 S 0.0 0.0 0:00.00 kworker/2:0H
18 root RT 0 0 0 0 S 0.0 0.0 0:01.44 migration/3
19 root 20 0 0 0 0 S 0.0 0.0 0:12.68 ksoftirqd/3
21 root 0 -20 0 0 0 S 0.0 0.0 0:00.00 kworker/3:0H
22 root 0 -20 0 0 0 S 0.0 0.0 0:00.00 khelper
23 root 20 0 0 0 0 S 0.0 0.0 0:00.00 kdevtmpfs
24 root 0 -20 0 0 0 S 0.0 0.0 0:00.00 netns
31 root 20 0 0 0 0 S 0.0 0.0 0:00.04 xenwatch
32 root 20 0 0 0 0 S 0.0 0.0 0:00.00 xenbus
130 root 0 -20 0 0 0 S 0.0 0.0 0:00.00 writeback
133 root 25 5 0 0 0 S 0.0 0.0 0:00.00 ksmd
134 root 39 19 0 0 0 S 0.0 0.0 0:00.00 khugepaged
135 root 0 -20 0 0 0 S 0.0 0.0 0:00.00 kintegrityd
EDIT3
I ran the following (during the heavy traffic phase) to track the MySQL processes, but there was nothing amiss in the results. The queries mentioned were all "fine" - nothing which could explain this really odd behavior.
mysqladmin -u DATABASEUSER -p -hIPADDRESS -i 1 --verbose processlist > /tmp/mysql-processlist3.txt
Have a look at the initial output (which WAS during the heavy traffic phase). Edited to remove redundancy.
+--------+--------------+-------------------+---------------+---------+------+-------+-----------------------+
| Id | User | Host | db | Command | Time | State | Info |
+--------+--------------+-------------------+---------------+---------+------+-------+-----------------------+
| 113267 | DATABASEUSER | IPADDRESS_1:55847 | DATABASE_NAME | Sleep | 12 | | |
| 113297 | DATABASEUSER | IPADDRESS_1:55942 | DATABASE_NAME | Sleep | 0 | | |
...
| 113310 | DATABASEUSER | IPADDRESS_1:55978 | DATABASE_NAME | Sleep | 0 | | |
| 113311 | DATABASEUSER | IPADDRESS_1:55982 | | Query | 0 | | show full processlist |
+--------+--------------+-------------------+---------------+---------+------+-------+-----------------------+
+--------+--------------+-------------------+---------------+---------+------+-------+-----------------------+
| Id | User | Host | db | Command | Time | State | Info |
+--------+--------------+-------------------+---------------+---------+------+-------+-----------------------+
| 113267 | DATABASEUSER | IPADDRESS_1:55847 | DATABASE_NAME | Sleep | 13 | | |
| 113301 | DATABASEUSER | IPADDRESS_1:55952 | DATABASE_NAME | Sleep | 0 | | |
...
| 113310 | DATABASEUSER | IPADDRESS_1:55978 | DATABASE_NAME | Sleep | 0 | | |
| 113311 | DATABASEUSER | IPADDRESS_1:55982 | | Query | 0 | | show full processlist |
| 113312 | DATABASEUSER | IPADDRESS_1:55985 | DATABASE_NAME | Sleep | 0 | | |
...
+--------+--------------+-------------------+---------------+---------+------+-------+-----------------------+
...
9 such instances (as above)
...
+--------+--------------+-------------------+---------------+---------+------+----------+----------------------------------------------------------------------+
| Id | User | Host | db | Command | Time | State | Info |
+--------+--------------+-------------------+---------------+---------+------+----------+----------------------------------------------------------------------+
| 113267 | DATABASEUSER | IPADDRESS_1:55847 | DATABASE_NAME | Sleep | 23 | | |
| 113311 | DATABASEUSER | IPADDRESS_1:55982 | | Query | 0 | | show full processlist |
| 113333 | DATABASEUSER | IPADDRESS_1:56047 | DATABASE_NAME | Sleep | 0 | | |
| 113334 | DATABASEUSER | IPADDRESS_1:56050 | DATABASE_NAME | Query | 0 | updating | DELETE FROM
Screenshot 2
Screenshot 3
Others:
EDIT1
During the high data traffic to the webserver, the htop output is as follows (on the MySQL server):
(I think very temporarily it shows up as high CPU usage)
Mostly it's like this:
EDIT2:
top command output on MySQL server while high CPU load on web server
top - 00:08:54 up 28 days, 23:46, 2 users, load average: 0.07, 0.06, 0.07
Tasks: 97 total, 1 running, 96 sleeping, 0 stopped, 0 zombie
Cpu(s): 11.2%us, 1.2%sy, 0.0%ni, 86.8%id, 0.6%wa, 0.0%hi, 0.2%si, 0.1%st
Mem: 31420088k total, 30966400k used, 453688k free, 166384k buffers
Swap: 4194300k total, 61328k used, 4132972k free, 8084828k cached
PID USER PR NI VIRT RES SHR S %CPU %MEM TIME+ COMMAND
13387 mysql 20 0 25.6g 21g 6884 S 17.9 70.5 263:34.95 mysqld
1 root 20 0 19596 1068 828 S 0.0 0.0 0:02.09 init
2 root 20 0 0 0 0 S 0.0 0.0 0:00.01 kthreadd
3 root 20 0 0 0 0 S 0.0 0.0 0:13.48 ksoftirqd/0
5 root 0 -20 0 0 0 S 0.0 0.0 0:00.00 kworker/0:0H
7 root 20 0 0 0 0 S 0.0 0.0 20:42.18 rcu_sched
8 root 20 0 0 0 0 S 0.0 0.0 0:00.00 rcu_bh
9 root RT 0 0 0 0 S 0.0 0.0 0:00.54 migration/0
10 root RT 0 0 0 0 S 0.0 0.0 0:00.46 migration/1
11 root 20 0 0 0 0 S 0.0 0.0 0:44.45 ksoftirqd/1
13 root 0 -20 0 0 0 S 0.0 0.0 0:00.00 kworker/1:0H
14 root RT 0 0 0 0 S 0.0 0.0 0:01.48 migration/2
15 root 20 0 0 0 0 S 0.0 0.0 0:44.13 ksoftirqd/2
17 root 0 -20 0 0 0 S 0.0 0.0 0:00.00 kworker/2:0H
18 root RT 0 0 0 0 S 0.0 0.0 0:01.44 migration/3
19 root 20 0 0 0 0 S 0.0 0.0 0:12.68 ksoftirqd/3
21 root 0 -20 0 0 0 S 0.0 0.0 0:00.00 kworker/3:0H
22 root 0 -20 0 0 0 S 0.0 0.0 0:00.00 khelper
23 root 20 0 0 0 0 S 0.0 0.0 0:00.00 kdevtmpfs
24 root 0 -20 0 0 0 S 0.0 0.0 0:00.00 netns
31 root 20 0 0 0 0 S 0.0 0.0 0:00.04 xenwatch
32 root 20 0 0 0 0 S 0.0 0.0 0:00.00 xenbus
130 root 0 -20 0 0 0 S 0.0 0.0 0:00.00 writeback
133 root 25 5 0 0 0 S 0.0 0.0 0:00.00 ksmd
134 root 39 19 0 0 0 S 0.0 0.0 0:00.00 khugepaged
135 root 0 -20 0 0 0 S 0.0 0.0 0:00.00 kintegrityd
EDIT3
I ran the following (during the heavy traffic phase) to track the MySQL processes, but there was nothing amiss in the results. The queries mentioned were all "fine" - nothing which could explain this really odd behavior.
mysqladmin -u DATABASEUSER -p -hIPADDRESS -i 1 --verbose processlist > /tmp/mysql-processlist3.txt
Have a look at the initial output (which WAS during the heavy traffic phase). Edited to remove redundancy.
+--------+--------------+-------------------+---------------+---------+------+-------+-----------------------+
| Id | User | Host | db | Command | Time | State | Info |
+--------+--------------+-------------------+---------------+---------+------+-------+-----------------------+
| 113267 | DATABASEUSER | IPADDRESS_1:55847 | DATABASE_NAME | Sleep | 12 | | |
| 113297 | DATABASEUSER | IPADDRESS_1:55942 | DATABASE_NAME | Sleep | 0 | | |
...
| 113310 | DATABASEUSER | IPADDRESS_1:55978 | DATABASE_NAME | Sleep | 0 | | |
| 113311 | DATABASEUSER | IPADDRESS_1:55982 | | Query | 0 | | show full processlist |
+--------+--------------+-------------------+---------------+---------+------+-------+-----------------------+
+--------+--------------+-------------------+---------------+---------+------+-------+-----------------------+
| Id | User | Host | db | Command | Time | State | Info |
+--------+--------------+-------------------+---------------+---------+------+-------+-----------------------+
| 113267 | DATABASEUSER | IPADDRESS_1:55847 | DATABASE_NAME | Sleep | 13 | | |
| 113301 | DATABASEUSER | IPADDRESS_1:55952 | DATABASE_NAME | Sleep | 0 | | |
...
| 113310 | DATABASEUSER | IPADDRESS_1:55978 | DATABASE_NAME | Sleep | 0 | | |
| 113311 | DATABASEUSER | IPADDRESS_1:55982 | | Query | 0 | | show full processlist |
| 113312 | DATABASEUSER | IPADDRESS_1:55985 | DATABASE_NAME | Sleep | 0 | | |
...
+--------+--------------+-------------------+---------------+---------+------+-------+-----------------------+
...
9 such instances (as above)
...
+--------+--------------+-------------------+---------------+---------+------+----------+----------------------------------------------------------------------+
| Id | User | Host | db | Command | Time | State | Info |
+--------+--------------+-------------------+---------------+---------+------+----------+----------------------------------------------------------------------+
| 113267 | DATABASEUSER | IPADDRESS_1:55847 | DATABASE_NAME | Sleep | 23 | | |
| 113311 | DATABASEUSER | IPADDRESS_1:55982 | | Query | 0 | | show full processlist |
| 113333 | DATABASEUSER | IPADDRESS_1:56047 | DATABASE_NAME | Sleep | 0 | | |
| 113334 | DATABASEUSER | IPADDRESS_1:56050 | DATABASE_NAME | Query | 0 | updating | DELETE FROM tablecore_session WHERE (session_expires
12198 root 20 0 117m 3356 2648 S 2.0 0.0 1:17.01 htop
17348 root 20 0 112m 7460 6368 S 1.7 0.0 0:00.05 sshd
32098 root 20 0 0 0 0 S 1.7 0.0 0:31.38 kworker/u16:0
6527 do_ssh_a 20 0 117m 3372 2524 S 1.3 0.0 41:25.85 htop
11820 do_ssh_a 20 0 117m 3728 2752 S 1.3 0.0 1:04.59 htop
13854 do_ssh_a 20 0 119m 5256 2616 S 1.3 0.0 0:49.03 htop
14045 do_ssh_a 20 0 117m 3356 2756 S 1.3 0.0 0:42.00 htop
17346 do_ssh_a 20 0 15268 2248 1872 R 0.7 0.0 0:00.02 top
7 root 20 0 0 0 0 S 0.3 0.0 8:01.96 rcu_sched
EDIT5
Full processlist output (which was referred to in EDIT3) is at: http://pastebin.com/7QBwnAW3
EDIT6
The difference in the data transfer speeds reported by iptraf and CloudWatch has been resolved. CloudWatch reports speeds per minute (as per email from AWS helpdesk inquiry), so:
As per CloudWatch,
we are consuming ~400 million (not mega) bytes per minute,
so 400/60 = 6.66 million bytes per second,
which is 6666 kilo bytes per second,
which at 8 bits per byte is: 53328 kilo bits per second.
Asked by siliconpi
(111 rep)
Dec 17, 2015, 01:37 PM
Last activity: Jan 10, 2020, 07:01 AM
Last activity: Jan 10, 2020, 07:01 AM