Finding reason for page splits
5
votes
1
answer
1581
views
So normally we have 20-85 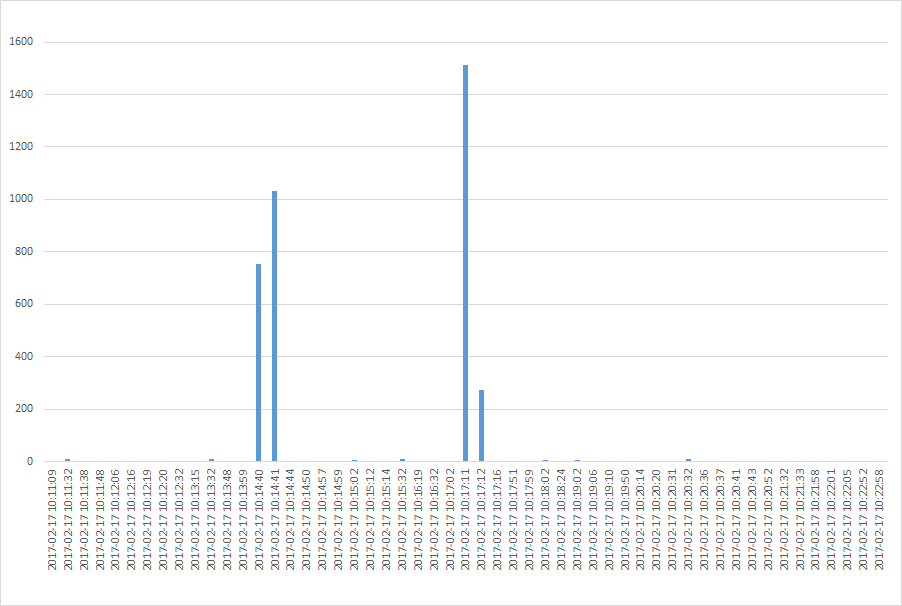 ','int') AS [database_id],
split.value('(/event/data[@name=''file_id'']/value)','int') AS [file_id],
split.value('(/event/data[@name=''page_id'']/value)','int') AS [page_id],
split.value('(/event[@name=''page_split'']/@timestamp)','datetime') AS [event_time],
split.value('(/event/action[@name=''sql_text'']/value)','varchar(max)') AS [sql_text]
FROM
(
SELECT CAST(event_data AS XML) AS split
FROM sys.fn_xe_file_target_read_file('***\MonitorPageSplits_0_131317886982910000.etx', '***\MonitorPageSplits_0_131317886982910000.mta', NULL, NULL)
) AS t
ORDER BY [event_time]
GO
Now plotting the data in excel diagram gave the following
So then i started to look at the data around
','int') AS [database_id],
split.value('(/event/data[@name=''file_id'']/value)','int') AS [file_id],
split.value('(/event/data[@name=''page_id'']/value)','int') AS [page_id],
split.value('(/event[@name=''page_split'']/@timestamp)','datetime') AS [event_time],
split.value('(/event/action[@name=''sql_text'']/value)','varchar(max)') AS [sql_text]
FROM
(
SELECT CAST(event_data AS XML) AS split
FROM sys.fn_xe_file_target_read_file('***\MonitorPageSplits_0_131317886982910000.etx', '***\MonitorPageSplits_0_131317886982910000.mta', NULL, NULL)
) AS t
ORDER BY [event_time]
GO
Now plotting the data in excel diagram gave the following
So then i started to look at the data around
Page splits/s but sometimes this spikes up the 700 - 2500 range.
So to figure out what was happening i created a Extended Event with the following:
CREATE EVENT SESSION MonitorPageSplits ON SERVER
ADD EVENT sqlserver.page_split
(
ACTION (sqlserver.database_id, sqlserver.sql_text)
)
ADD TARGET package0.asynchronous_file_target
(
SET
filename = N'***\MonitorPageSplits.etx',
metadatafile = N'***\MonitorPageSplits.mta'
);
GO
ALTER EVENT SESSION MonitorPageSplits ON SERVER STATE = start;
GO
--Wait until we notice a page split and run code below!
ALTER EVENT SESSION MonitorPageSplits ON SERVER STATE = STOP;
GO
Then to get the data i used the following query
SELECT
split.value('(/event/action[@name=''database_id'']/value)','int') AS [database_id],
split.value('(/event/data[@name=''file_id'']/value)','int') AS [file_id],
split.value('(/event/data[@name=''page_id'']/value)','int') AS [page_id],
split.value('(/event[@name=''page_split'']/@timestamp)','datetime') AS [event_time],
split.value('(/event/action[@name=''sql_text'']/value)','varchar(max)') AS [sql_text]
FROM
(
SELECT CAST(event_data AS XML) AS split
FROM sys.fn_xe_file_target_read_file('***\MonitorPageSplits_0_131317886982910000.etx', '***\MonitorPageSplits_0_131317886982910000.mta', NULL, NULL)
) AS t
ORDER BY [event_time]
GO
Now plotting the data in excel diagram gave the following
So then i started to look at the data around 2017-02-17 10:14:39 as the first spike then.
Which resulted in the following data:
database_id file_id page_id event_time sql_text
7 0 0 2017-02-17 10:14:39.603 Unable to retrieve SQL text
7 1 26536 2017-02-17 10:14:39.603 Unable to retrieve SQL text
7 1 26536 2017-02-17 10:14:39.603 Unable to retrieve SQL text
7 1 26536 2017-02-17 10:14:39.607 Unable to retrieve SQL text
7 1 37769 2017-02-17 10:14:39.607 Unable to retrieve SQL text
.....
So then i used the following DBCC TRACEON (3604);dbcc page (7, 1, 26536, 1);DBCC TRACEOFF (3604); and that gave me Metadata: ObjectId and with that i could get the table.
But how do i figure out what caused the page split spike?
Also database_id 7 is the main application on the server and file_id 1 is the Data file of the database.
Some more analysis:
3 tables are involved
2 small tables that are involved in one page split each.
The rest of page splits are caused in the table that has the most data and most inserts/updates in the application.
Am i worrying for nothing is it normal to have page splits like this?
Asked by Peter
(287 rep)
Feb 17, 2017, 02:41 PM
Last activity: Feb 20, 2017, 04:21 PM
Last activity: Feb 20, 2017, 04:21 PM