We've been experimenting with Polybase on a SQL Server 2019 (CU2) box, using SQL Server external data sources and the performance has not been good - in most cases a 1400% increase. In each case all of the tables/views we're querying are from external tables pointing at the same external data source. We've tried both running the query broken out on the local box, and using the same query as a view pulled in as an external table. We've also scripted every statistic from the remote server onto the external tables with no change. You can see the performance difference below, using a sample query.
The servers are setup identical resource wise: 32GBs of RAM, 8 vCPU, SSD disks, and no other running queries. I've tried against two different remote servers, one running SQL Server 2016 with the latest SP/CU, and a separate 2019 box running CU2. The servers are VMs running on the same host, and we've ruled out any type of host contention.
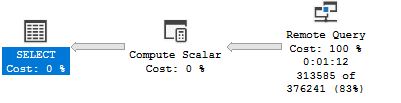
Sample Query:
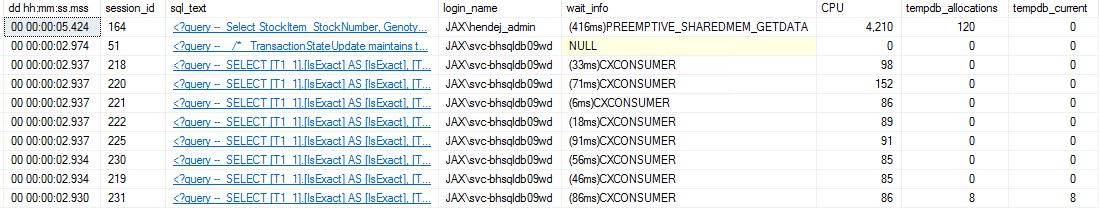
 sp_whoisactive (wait info) shortly after starting Polybase query:
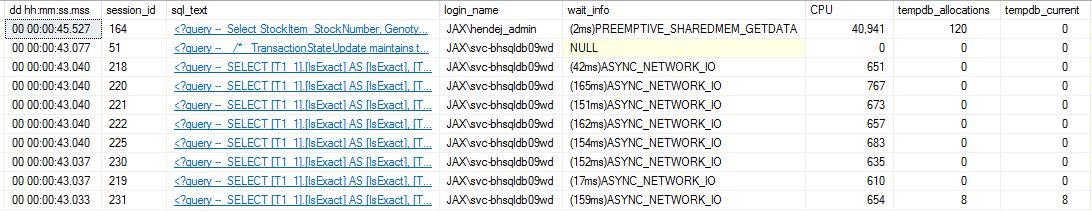
 sp_whoisactive (wait info) further into the Polybase query:
 Using a Linked Server instead of Polybase:
 ********************
***Second update on 2/23/2020:***
I created a single large table and I ran a "select *" both locally and over Polybase. Those runs have almost identical run times. I opened a support case with Microsoft and I'll report back if we make any headway.
********************
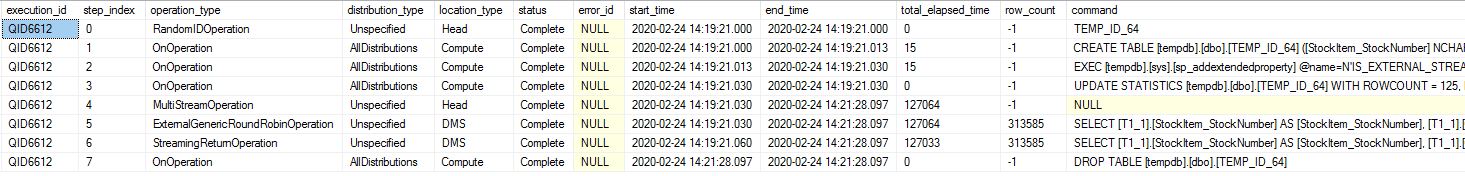
***Update on 2/24/2020:***
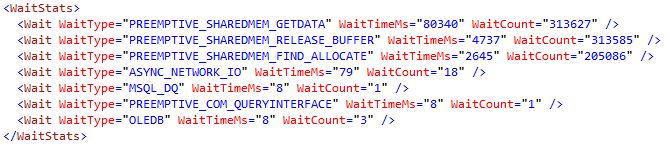
After Kevin's response (below) I made a few tweaks to the original post for clarity, and running the queries/DMVs he referenced comes back with these results:
********************
***Second update on 2/23/2020:***
I created a single large table and I ran a "select *" both locally and over Polybase. Those runs have almost identical run times. I opened a support case with Microsoft and I'll report back if we make any headway.
********************
***Update on 2/24/2020:***
After Kevin's response (below) I made a few tweaks to the original post for clarity, and running the queries/DMVs he referenced comes back with these results:
SELECT
     StockItem_StockNumber, BlanktypeId, NameHTML, BackgroundStrainName, IsExact, IsConditional
     ,ROW_NUMBER() Over(Partition By StockItem_StockNumber, BlanktypeId Order By pt.Name, p.Name, gptr.Text) as row_num
     ,pt.Name as Level1, p.Name as Level2, gptr.Text as Level3, MGIReference_JNumber
     ,gptr.Type as Level3Type
FROM
     1 sig
     INNER JOIN 2 g on g.BlanktypeId = sig.Blanktype_BlanktypeId
     INNER JOIN 3 gpt on gpt.Blanktype_BlanktypeId = g.BlanktypeId
     INNER JOIN 4 p on p.StocktypeTermId = gpt.StocktypeTerm_StocktypeTermId
     INNER JOIN 5 gptr on gptr.BlanktypeStockTerm_BlanktypeStockTermId = gpt.BlanktypeStockTermId
     INNER JOIN 6 ptc on ptc.ChildStockTerm_StocktypeTermId = p.StocktypeTermId
     INNER JOIN 7 pt on pt.StocktypeTermId = ptc.ParentStockTerm_StocktypeTermId
WHERE
ptc.ParentHeaderKey = 3SQL Server Execution Times:
CPU time = 3486 ms, elapsed time = 5035 ms.SQL Server Execution Times:
CPU time = 15016 ms, elapsed time = 92113 ms.SQL Server Execution Times:
CPU time = 3875 ms, elapsed time = 74149 ms.SQL Server Execution Times:
CPU time = 3032 ms, elapsed time = 9316 ms.
Asked by Select 'DBA'
(165 rep)
Feb 12, 2020, 07:30 PM
Last activity: Dec 6, 2022, 02:17 PM
Last activity: Dec 6, 2022, 02:17 PM