Query performance discrepancy between Azure and on premise SQL Server
0
votes
1
answer
261
views
I have the same database on both SQL Azure and on premise. Most of my queries run in similar time on the two instances but I have a handful of queries where the performance difference is on the order of 60x. I suspected that maybe I just didn't have a sufficiently large instance so I scaled to a 4 vCore instance with ~20 gig of memory. As my entire database is only 4.5 GB this seemed like it would be able to hold the entire database in memory.
Turning on IO stats and running the query on the on premise box yields results like
 Now that
 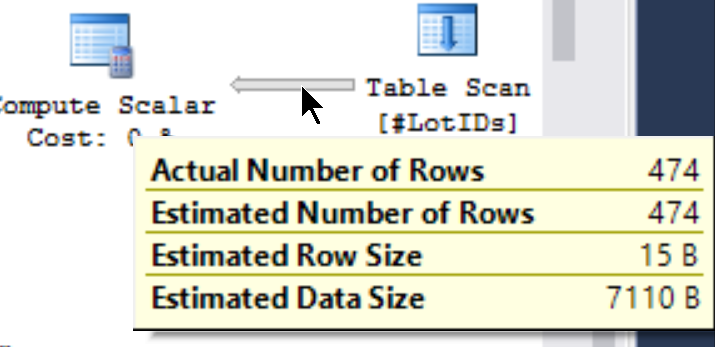 **Update**
I reduced the query down to a simple query which shows some of the same performance issues
**Update**
I reduced the query down to a simple query which shows some of the same performance issues
Table 'tblCurrentPlateActivity'. Scan count 1, logical reads 201, physical reads 0, read-ahead reads 0, lob logical reads 0, lob physical reads 0, lob read-ahead reads 0.
Table 'tblViolationStatus'. Scan count 1, logical reads 300, physical reads 0, read-ahead reads 0, lob logical reads 0, lob physical reads 0, lob read-ahead reads 0.
Table 'tblCostStructureTier'. Scan count 101, logical reads 401, physical reads 0, read-ahead reads 0, lob logical reads 0, lob physical reads 0, lob read-ahead reads 0.
Table 'tblViolation'. Scan count 474, logical reads 2106236, physical reads 0, read-ahead reads 0, lob logical reads 0, lob physical reads 0, lob read-ahead reads 0.
Table 'tblCostStructure'. Scan count 0, logical reads 190, physical reads 0, read-ahead reads 0, lob logical reads 0, lob physical reads 0, lob read-ahead reads 0.
Table 'tblProvinceState'. Scan count 0, logical reads 200, physical reads 0, read-ahead reads 0, lob logical reads 0, lob physical reads 0, lob read-ahead reads 0.
Table 'tblGroup'. Scan count 0, logical reads 200, physical reads 0, read-ahead reads 0, lob logical reads 0, lob physical reads 0, lob read-ahead reads 0.
Table '#GroupIDs___________________________________________________________________________________________________________00000000011F'. Scan count 1, logical reads 100, physical reads 0, read-ahead reads 0, lob logical reads 0, lob physical reads 0, lob read-ahead reads 0.
Table 'tblLot'. Scan count 0, logical reads 215, physical reads 0, read-ahead reads 0, lob logical reads 0, lob physical reads 0, lob read-ahead reads 0.
Table 'Workfile'. Scan count 0, logical reads 0, physical reads 0, read-ahead reads 0, lob logical reads 0, lob physical reads 0, lob read-ahead reads 0.
Table 'Worktable'. Scan count 0, logical reads 0, physical reads 0, read-ahead reads 0, lob logical reads 0, lob physical reads 0, lob read-ahead reads 0.
Table '#LotIDs_____________________________________________________________________________________________________________000000000120'. Scan count 1, logical reads 2, physical reads 0, read-ahead reads 0, lob logical reads 0, lob physical reads 0, lob read-ahead reads 0.
Table '#PlateProvinceStateIDs______________________________________________________________________________________________000000000122'. Scan count 1, logical reads 1, physical reads 0, read-ahead reads 0, lob logical reads 0, lob physical reads 0, lob read-ahead reads 0.
Table '#ProvinceStatesIDs__________________________________________________________________________________________________000000000121'. Scan count 1, logical reads 1, physical reads 0, read-ahead reads 0, lob logical reads 0, lob physical reads 0, lob read-ahead reads 0.
Table 'tblViolationType'. Scan count 1, logical reads 2, physical reads 0, read-ahead reads 0, lob logical reads 0, lob physical reads 0, lob read-ahead reads 0.
Table '#LotDate____________________________________________________________________________________________________________00000000011E'. Scan count 1, logical reads 2, physical reads 0, read-ahead reads 0, lob logical reads 0, lob physical reads 0, lob read-ahead reads 0.tblViolation which I would expect. On SQL Azure I see similar results for most tables
Table 'tblCurrentPlateActivity'. Scan count 1, logical reads 201, physical reads 0, page server reads 0, read-ahead reads 0, page server read-ahead reads 0, lob logical reads 0, lob physical reads 0, lob page server reads 0, lob read-ahead reads 0, lob page server read-ahead reads 0.
Table 'tblViolationStatus'. Scan count 1, logical reads 300, physical reads 0, page server reads 0, read-ahead reads 0, page server read-ahead reads 0, lob logical reads 0, lob physical reads 0, lob page server reads 0, lob read-ahead reads 0, lob page server read-ahead reads 0.
Table 'tblCostStructureTier'. Scan count 101, logical reads 401, physical reads 0, page server reads 0, read-ahead reads 0, page server read-ahead reads 0, lob logical reads 0, lob physical reads 0, lob page server reads 0, lob read-ahead reads 0, lob page server read-ahead reads 0.
Table 'Worktable'. Scan count 200, logical reads 797, physical reads 0, page server reads 0, read-ahead reads 0, page server read-ahead reads 0, lob logical reads 0, lob physical reads 0, lob page server reads 0, lob read-ahead reads 0, lob page server read-ahead reads 0.
Table 'tblViolation'. Scan count 1, logical reads 2082323, physical reads 0, page server reads 0, read-ahead reads 0, page server read-ahead reads 0, lob logical reads 0, lob physical reads 0, lob page server reads 0, lob read-ahead reads 0, lob page server read-ahead reads 0.
Table 'tblCostStructure'. Scan count 0, logical reads 190, physical reads 0, page server reads 0, read-ahead reads 0, page server read-ahead reads 0, lob logical reads 0, lob physical reads 0, lob page server reads 0, lob read-ahead reads 0, lob page server read-ahead reads 0.
Table '#LotDate____________________________________________________________________________________________________________000000000072'. Scan count 1, logical reads 1336728, physical reads 0, page server reads 0, read-ahead reads 0, page server read-ahead reads 0, lob logical reads 0, lob physical reads 0, lob page server reads 0, lob read-ahead reads 0, lob page server read-ahead reads 0.
Table 'tblProvinceState'. Scan count 0, logical reads 1336728, physical reads 0, page server reads 0, read-ahead reads 0, page server read-ahead reads 0, lob logical reads 0, lob physical reads 0, lob page server reads 0, lob read-ahead reads 0, lob page server read-ahead reads 0.
Table 'tblGroup'. Scan count 0, logical reads 1336728, physical reads 0, page server reads 0, read-ahead reads 0, page server read-ahead reads 0, lob logical reads 0, lob physical reads 0, lob page server reads 0, lob read-ahead reads 0, lob page server read-ahead reads 0.
Table '#GroupIDs___________________________________________________________________________________________________________000000000073'. Scan count 1, logical reads 668364, physical reads 0, page server reads 0, read-ahead reads 0, page server read-ahead reads 0, lob logical reads 0, lob physical reads 0, lob page server reads 0, lob read-ahead reads 0, lob page server read-ahead reads 0.
Table 'tblLot'. Scan count 0, logical reads 1378509, physical reads 0, page server reads 0, read-ahead reads 0, page server read-ahead reads 0, lob logical reads 0, lob physical reads 0, lob page server reads 0, lob read-ahead reads 0, lob page server read-ahead reads 0.
Table '#PlateProvinceStateIDs______________________________________________________________________________________________000000000076'. Scan count 1, logical reads 668364, physical reads 0, page server reads 0, read-ahead reads 0, page server read-ahead reads 0, lob logical reads 0, lob physical reads 0, lob page server reads 0, lob read-ahead reads 0, lob page server read-ahead reads 0.
Table '#ProvinceStatesIDs__________________________________________________________________________________________________000000000075'. Scan count 1, logical reads 673785, physical reads 0, page server reads 0, read-ahead reads 0, page server read-ahead reads 0, lob logical reads 0, lob physical reads 0, lob page server reads 0, lob read-ahead reads 0, lob page server read-ahead reads 0.
Table '#LotIDs_____________________________________________________________________________________________________________000000000074'. Scan count 1, logical reads 871241, physical reads 0, page server reads 0, read-ahead reads 0, page server read-ahead reads 0, lob logical reads 0, lob physical reads 0, lob page server reads 0, lob read-ahead reads 0, lob page server read-ahead reads 0.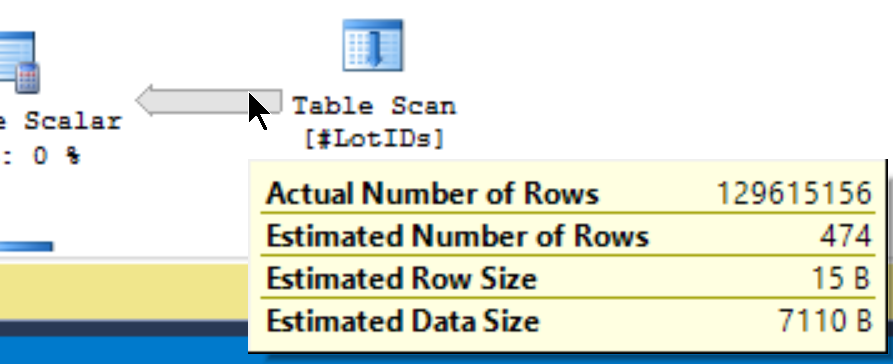
Table 'tblViolationType'. Scan count 0, logical reads 1347570, physical reads 0, page server reads 0, read-ahead reads 0, page server read-ahead reads 0, lob logical reads 0, lob physical reads 0, lob page server reads 0, lob read-ahead reads 0, lob page server read-ahead reads 0.#tblLot is generated as part of the query and I know that is only has those 474 records in it. What could be causing such a weird discrepancy and how would I solve it? I imagine the query plan is super inefficient because of this miscalculation of number of rows. The on premise database shows the rows correctly.
I'm happy to include query plans here but I'm not really sure what the best way is to do that. Export the .sqlplan?
**Update**
I reduced the query down to a simple query which shows some of the same performance issues
SELECT top 100 Case when ISNULL(cpa.tow, 0) = 0 then '-'
			else 'TW'
			end as PlateActivityFormatted,
			Case when v.ViolationStatusID = 6 then 1
			else 0 end  AS IsOverdueToday,
			v.ViolationStatusID AS OriginalViolationStatusID,
			v.ViolationStatusID AS RevisedViolationStatusID,
			vs.StatusShortName AS RevisedViolationStatusDescription,
			tblGroup.Name AS LotGroupName,
			cpa.tow As PlateTowing,
			[tblProvinceState].Name as ProvinceState,
			[tblLot].TaxNumber,
			[tblLot].Name LotName,
			v.*
	   FROM [tblViolation] v INNER JOIN
			[ViolationFinanceInformation] on [ViolationFinanceInformation].ViolationID = v.ID INNER JOIN
			[tblViolationType] on [tblViolationType].ID = v.ViolationTypeID JOIN
			[tblLot] ON v.LotID = [tblLot].ID JOIN
			[tblGroup] ON [tblLot].GroupID = [tblGroup].ID JOIN
			[tblProvinceState] ON [tblLot].ProvinceStateID = [tblProvinceState].ID LEFT JOIN
			tblViolationStatus vs ON vs.StatusID = v.ViolationStatusID LEFT JOIN
			tblCurrentPlateActivity cpa ON cpa.vendorId = tblGroup.vendorid and cpa.plateNumber = v.plateNumber
			INNER JOIN #LotDate on #LotDate.ID = tblLot.ID
		where Issued >= #LotDate.Start
Asked by stimms
(353 rep)
Mar 29, 2020, 02:31 PM
Last activity: Jun 2, 2025, 10:04 PM
Last activity: Jun 2, 2025, 10:04 PM