MongoDB - 100% CPU - recovering shard (after killing updates)
2
votes
0
answers
207
views
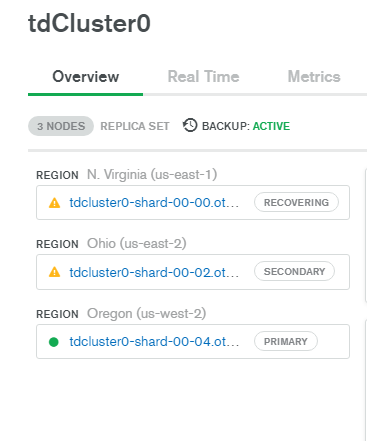
Can a recovering shard (as shown below) drive CPU to 100% for hours and hours?
I have killed all the queries and updates (based on db.currentOp()) and stopped the flow of new data, but the CPU stays at 100%.
I can run little queries, but deleting 200 rows (via an index) runs for hours.
Inserts are getting backed up and not performing timely. We have a large collection (almost 200 GB) with about 5 indexes.
Can the server be doing internal clean-up that runs the CPU so high that our normal flow of data bogs down?
 (running cloud/Atlas)
In the db.currentOps(), I see quite a few that look like the json below; these don't seem to represent any queries, inserts, updates, or deletes that we are running or started.
{
"type": "op",
"host": "atlas-10ydpn-shard-00-04.otwxp.mongodb.net:27017",
"desc": "conn1280774",
"connectionId": 1280774,
"client": "54.221.39.10:59692",
"clientMetadata": {
"driver": {
"name": "PyMongo",
"version": "3.11.0"
},
"os": {
"type": "Linux",
"name": "Linux",
"architecture": "x86_64",
"version": "4.14.193-110.317.amzn2.x86_64"
},
"platform": "CPython 3.7.9.final.0"
},
"active": true,
"currentOpTime": "2020-10-22T12:52:12.100+0000",
"effectiveUsers": [
{
"user": "pythonapp",
"db": "admin"
}
],
"opid": 20478470,
"lsid": {
"id": "059e860217054269a3f30c93a7b9c9cb",
"uid": null
},
"secs_running": 2370,
"microsecs_running": 2370403369,
"op": "command",
"ns": "relatixtd.$cmd",
"command": {
"update": "ProdPolygonIOQuotes",
"ordered": true,
"writeConcern": {
"w": "majority"
},
"lsid": {
"id": "059e860217054269a3f30c93a7b9c9cb"
},
"txnNumber": 1,
"$clusterTime": {
"clusterTime": null,
"signature": {
"hash": null,
"keyId": 6857244042040705026
}
},
"$db": "relatixtd"
},
"numYields": 1,
"waitingForLatch": {
"timestamp": null,
"captureName": "ReplicationCoordinatorImpl::_mutex"
},
"locks": {},
"waitingForLock": false,
"lockStats": {
"ParallelBatchWriterMode": {
"acquireCount": {
"r": 4
}
},
"ReplicationStateTransition": {
"acquireCount": {
"w": 6
}
},
"Global": {
"acquireCount": {
"r": 2,
"w": 3
}
},
"Database": {
"acquireCount": {
"r": 1,
"w": 3
}
},
"Collection": {
"acquireCount": {
"r": 1,
"w": 3
}
},
"Mutex": {
"acquireCount": {
"r": 4
}
}
},
"waitingForFlowControl": false,
"flowControlStats": {
"acquireCount": 2,
"timeAcquiringMicros": 1
}
},
(running cloud/Atlas)
In the db.currentOps(), I see quite a few that look like the json below; these don't seem to represent any queries, inserts, updates, or deletes that we are running or started.
{
"type": "op",
"host": "atlas-10ydpn-shard-00-04.otwxp.mongodb.net:27017",
"desc": "conn1280774",
"connectionId": 1280774,
"client": "54.221.39.10:59692",
"clientMetadata": {
"driver": {
"name": "PyMongo",
"version": "3.11.0"
},
"os": {
"type": "Linux",
"name": "Linux",
"architecture": "x86_64",
"version": "4.14.193-110.317.amzn2.x86_64"
},
"platform": "CPython 3.7.9.final.0"
},
"active": true,
"currentOpTime": "2020-10-22T12:52:12.100+0000",
"effectiveUsers": [
{
"user": "pythonapp",
"db": "admin"
}
],
"opid": 20478470,
"lsid": {
"id": "059e860217054269a3f30c93a7b9c9cb",
"uid": null
},
"secs_running": 2370,
"microsecs_running": 2370403369,
"op": "command",
"ns": "relatixtd.$cmd",
"command": {
"update": "ProdPolygonIOQuotes",
"ordered": true,
"writeConcern": {
"w": "majority"
},
"lsid": {
"id": "059e860217054269a3f30c93a7b9c9cb"
},
"txnNumber": 1,
"$clusterTime": {
"clusterTime": null,
"signature": {
"hash": null,
"keyId": 6857244042040705026
}
},
"$db": "relatixtd"
},
"numYields": 1,
"waitingForLatch": {
"timestamp": null,
"captureName": "ReplicationCoordinatorImpl::_mutex"
},
"locks": {},
"waitingForLock": false,
"lockStats": {
"ParallelBatchWriterMode": {
"acquireCount": {
"r": 4
}
},
"ReplicationStateTransition": {
"acquireCount": {
"w": 6
}
},
"Global": {
"acquireCount": {
"r": 2,
"w": 3
}
},
"Database": {
"acquireCount": {
"r": 1,
"w": 3
}
},
"Collection": {
"acquireCount": {
"r": 1,
"w": 3
}
},
"Mutex": {
"acquireCount": {
"r": 4
}
}
},
"waitingForFlowControl": false,
"flowControlStats": {
"acquireCount": 2,
"timeAcquiringMicros": 1
}
},
Asked by NealWalters
(577 rep)
Oct 22, 2020, 01:15 PM
Last activity: Oct 22, 2020, 01:30 PM
Last activity: Oct 22, 2020, 01:30 PM