Availability Group- Redo Rate displayed on AG Dashboard vs Perfmon counter
3
votes
1
answer
793
views
I am bit confused on checking the metrics for *REDO Rate KB/Sec* from Always on AG dashboard, which for some scenarios matches with perfmon counter *Database replica : Redone Bytes/Sec* ( hopefully it's the correct counter for redo rate via perfmon), and sometimes not at all.
Most of the times when there is lot of activity ongoing, my belief is that AG dashboard and DMV shows REDO rate for e.g. 40 MB/Secs at given time which matches with perfmon counter.
However, during less activity time or nothing much to send over to sec, REDO Rate on Dashboard and dmv seems to be showing incorrect values compared to perfmon counter.
Not able to understand which value is correct and how to analyze. Any idea why or is it bug in dashboard?
Screenshot as requested:
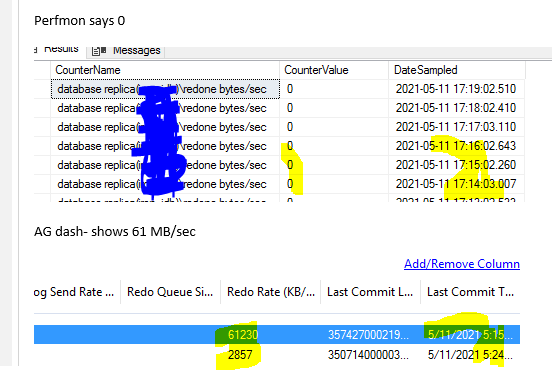 No transactions occurred around that time - no major activity on primary end. I am collecting that perfmon on secondary and primary since after failover new secondary we would still need those counters running. However the data pulled in screenshot perfmon data is from secondary.
No transactions occurred around that time - no major activity on primary end. I am collecting that perfmon on secondary and primary since after failover new secondary we would still need those counters running. However the data pulled in screenshot perfmon data is from secondary.
Asked by BeginnerDBA
(2230 rep)
May 12, 2021, 02:32 PM
Last activity: May 14, 2021, 09:01 AM
Last activity: May 14, 2021, 09:01 AM