In a star scheme, How to define the fact table when the data has different levels of dimensions?
0
votes
1
answer
168
views
In a PowerBI project, I need some help to define the fact table/s.
Eventually, I would like to have a nice star scheme to preset some basic visuals as stacked bar etc. to the client.
I'm new to BI and I'm afraid that I'm missing here something very obvious.
Description of the data
=======================
I have data stored in a tables:
**City**, **Company**, **Budget**, **CategorizedBudget** and **Expense**.
The **City** table contain city name and region.
| ID | City | Region |
| -- | ----------- | ------ |
| 1 | RocksVille | Center |
| 2 | GoldCity | North |
The **Company** table contain company name and city.
| ID | Company | FK_CityID |
| -- | ----------- | --------- |
| 1 | Nissan | 1 |
| 2 | Herosh LTD | 2 |
The **Budget** table contain companies annual budget amounts.
| ID | FK_CompanyID | Year | Amount |
| -- | ------------ | ---- | --------- |
| 1 | 1 | 2019 | 1000000 $ |
| 2 | 1 | 2020 | 1400000 $ |
The **CategorizedBudget** table contain **some** of the annual budget amounts of those companies, divided by categories
| ID | FK_BudgetID | Category | Amount |
| -- | ----------- | ---------- | -------- |
| 1 | 1 | Category A | 400000 $ |
| 2 | 1 | Category B | 300000 $ |
| 3 | 1 | Category C | 300000 $ |
The **Expense** table contain tertile budget amounts of those companies, divided by categories.
| ID | FK_CompanyID | Year | Tertile | Category | Amount |
| -- | ------------ | ---- | ------- | ---------- | -------- |
| 1 | 1 | 2019 | 1 | Category A | 100000 $ |
| 2 | 1 | 2019 | 1 | Category B | 100000 $ |
| 3 | 1 | 2019 | 1 | Category C | 150000 $ |
| 4 | 1 | 2019 | 2 | Category A | 150000 $ |
| 5 | 1 | 2019 | 2 | Category B | 50000 $ |
| 6 | 1 | 2019 | 2 | Category C | 150000 $ |
| 7 | 1 | 2019 | 3 | Category A | 100000 $ |
| 8 | 1 | 2019 | 3 | Category B | 150000 $ |
| 9 | 1 | 2019 | 3 | Category C | 50000 $ |
Expected Result
===============
The visuals should be:
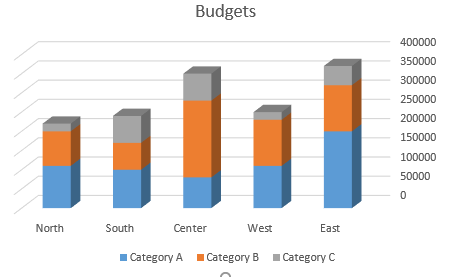
1. Stacked Column Chart that show sum of the annual **budget** amounts for the companies city regions
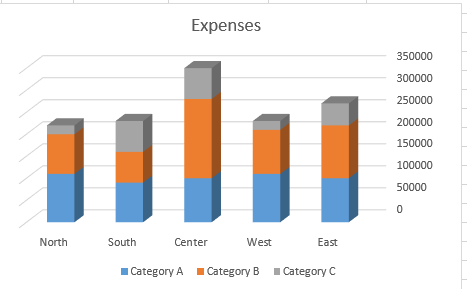
 2. Stacked Column Chart that show sum of the annual **expenses** amounts for the companies city regions
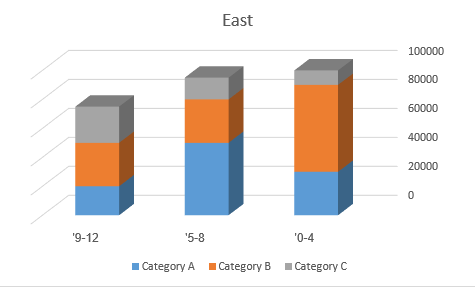
 3. when drilling to the **expenses**, show the amounts by tertiles.
 Dimensions
==========
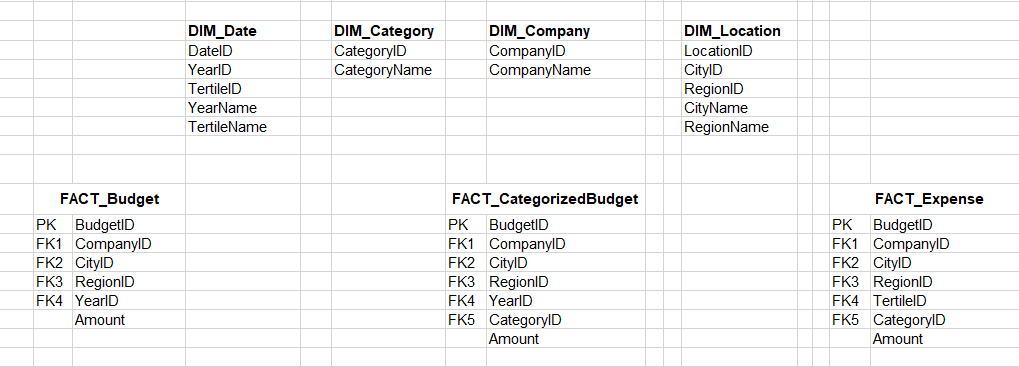
It appears that the dimensions are: **Date** (year, tertile), **Location** (city, region), **Category** (name), **Comapny** (name)
Fact/s
======
The fact is where I'm getting confused. I thought about some practices:
First thought
-------------
Merging **Budget** and **CategorizedBudget** and **Expenses** into one fact.
| ID | FK_CompanyID | Year | Tertile | Category | ExpensesAmount | BudgetAmount |
| -- | ------------ | ---- | ------- | ---------- | ---------------- | ---------------- |
| 1 | 1 | 2019 | 1 | Category A | 100000 $ | ? |
| 2 | 1 | 2019 | 1 | Category B | 100000 $ | ? |
| 3 | 1 | 2019 | 1 | Category C | 150000 $ | ? |
| 4 | 1 | 2019 | 2 | Category A | 100000 $ | ? |
| 5 | 1 | 2019 | 2 | Category B | 100000 $ | ? |
| 6 | 1 | 2019 | 2 | Category C | 150000 $ | ? |
But the budget annual amounts are not divided to tertiles.
Second thought:
--
Merging the **Budget** and **CategorizedBudget** to one fact and getting the Expenses as one fact.
| ID | FK_CompanyID | Year | Category | BudgetAmount |
| -- | ------------ | ---- | ---------- | ---------------- |
| 1 | 1 | 2019 | Category A | 100000 $ |
| 2 | 1 | 2019 | Category B | 100000 $ |
| 3 | 1 | 2019 | Category C | 150000 $ |
| 4 | 1 | 2020 | Category A | ? |
| 5 | 1 | 2020 | Category B | ? |
| 6 | 1 | 2020 | Category C | ? |
But some of the budget annual amounts are not categorized.
Third thought:
--
Use three facts for **Budget** and **CategorizedBudget** and **Expenses**
Dimensions
==========
It appears that the dimensions are: **Date** (year, tertile), **Location** (city, region), **Category** (name), **Comapny** (name)
Fact/s
======
The fact is where I'm getting confused. I thought about some practices:
First thought
-------------
Merging **Budget** and **CategorizedBudget** and **Expenses** into one fact.
| ID | FK_CompanyID | Year | Tertile | Category | ExpensesAmount | BudgetAmount |
| -- | ------------ | ---- | ------- | ---------- | ---------------- | ---------------- |
| 1 | 1 | 2019 | 1 | Category A | 100000 $ | ? |
| 2 | 1 | 2019 | 1 | Category B | 100000 $ | ? |
| 3 | 1 | 2019 | 1 | Category C | 150000 $ | ? |
| 4 | 1 | 2019 | 2 | Category A | 100000 $ | ? |
| 5 | 1 | 2019 | 2 | Category B | 100000 $ | ? |
| 6 | 1 | 2019 | 2 | Category C | 150000 $ | ? |
But the budget annual amounts are not divided to tertiles.
Second thought:
--
Merging the **Budget** and **CategorizedBudget** to one fact and getting the Expenses as one fact.
| ID | FK_CompanyID | Year | Category | BudgetAmount |
| -- | ------------ | ---- | ---------- | ---------------- |
| 1 | 1 | 2019 | Category A | 100000 $ |
| 2 | 1 | 2019 | Category B | 100000 $ |
| 3 | 1 | 2019 | Category C | 150000 $ |
| 4 | 1 | 2020 | Category A | ? |
| 5 | 1 | 2020 | Category B | ? |
| 6 | 1 | 2020 | Category C | ? |
But some of the budget annual amounts are not categorized.
Third thought:
--
Use three facts for **Budget** and **CategorizedBudget** and **Expenses**
 But it looks not starry at all.. and I'm afraid It will be complicated if I'll have to add more fact and dimensions later.
It also feel like I'm duplicating something here.
Any help would be appreciated
But it looks not starry at all.. and I'm afraid It will be complicated if I'll have to add more fact and dimensions later.
It also feel like I'm duplicating something here.
Any help would be appreciated
2. Stacked Column Chart that show sum of the annual **expenses** amounts for the companies city regions
3. when drilling to the **expenses**, show the amounts by tertiles.
Dimensions
==========
It appears that the dimensions are: **Date** (year, tertile), **Location** (city, region), **Category** (name), **Comapny** (name)
Fact/s
======
The fact is where I'm getting confused. I thought about some practices:
First thought
-------------
Merging **Budget** and **CategorizedBudget** and **Expenses** into one fact.
| ID | FK_CompanyID | Year | Tertile | Category | ExpensesAmount | BudgetAmount |
| -- | ------------ | ---- | ------- | ---------- | ---------------- | ---------------- |
| 1 | 1 | 2019 | 1 | Category A | 100000 $ | ? |
| 2 | 1 | 2019 | 1 | Category B | 100000 $ | ? |
| 3 | 1 | 2019 | 1 | Category C | 150000 $ | ? |
| 4 | 1 | 2019 | 2 | Category A | 100000 $ | ? |
| 5 | 1 | 2019 | 2 | Category B | 100000 $ | ? |
| 6 | 1 | 2019 | 2 | Category C | 150000 $ | ? |
But the budget annual amounts are not divided to tertiles.
Second thought:
--
Merging the **Budget** and **CategorizedBudget** to one fact and getting the Expenses as one fact.
| ID | FK_CompanyID | Year | Category | BudgetAmount |
| -- | ------------ | ---- | ---------- | ---------------- |
| 1 | 1 | 2019 | Category A | 100000 $ |
| 2 | 1 | 2019 | Category B | 100000 $ |
| 3 | 1 | 2019 | Category C | 150000 $ |
| 4 | 1 | 2020 | Category A | ? |
| 5 | 1 | 2020 | Category B | ? |
| 6 | 1 | 2020 | Category C | ? |
But some of the budget annual amounts are not categorized.
Third thought:
--
Use three facts for **Budget** and **CategorizedBudget** and **Expenses**
But it looks not starry at all.. and I'm afraid It will be complicated if I'll have to add more fact and dimensions later.
It also feel like I'm duplicating something here.
Any help would be appreciated
Asked by ShayD
(1 rep)
Jan 4, 2022, 05:10 PM
Last activity: Jul 6, 2025, 03:03 PM
Last activity: Jul 6, 2025, 03:03 PM