DBCC CHECKDB on a user database: Time-out occurred while waiting for buffer latch type 2 for page (X:XXX), database ID 2
6
votes
1
answer
4493
views
Our Ola Hallengren IntegrityCheck job failed due to a buffer latch timeout while running DBCC CHECKDB on a user database.
However, the buffer latch timeout reported was in TempDB (database ID 2).
Output from the job:
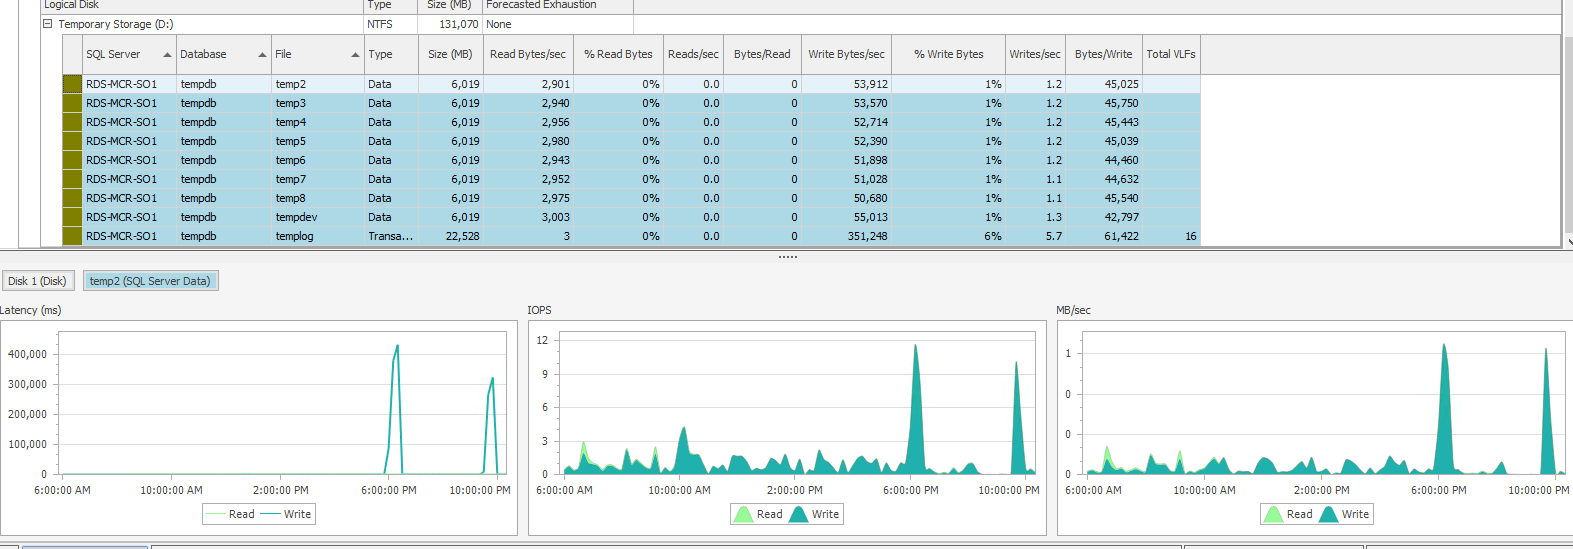 These latency spikes do not correlate with any spikes in the Azure Monitor metrics
Date and time: 2022-01-22 09:04:15 [SQLSTATE 01000]
Database context: [master] [SQLSTATE 01000]
Command: SET LOCK_TIMEOUT 600000; DBCC CHECKDB ([SentryOne]) WITH NO_INFOMSGS, ALL_ERRORMSGS, MAXDOP = 4 [SQLSTATE 01000]
Msg 845, Sev 17, State 1, Line 1 : Time-out occurred while waiting for buffer latch type 2 for page (6:222), database ID 2. [SQLSTATE 42000]
Outcome: Failed [SQLSTATE 01000]
Duration: 12:40:32 [SQLSTATE 01000]
Date and time: 2022-01-22 21:44:47 [SQLSTATE 01000]Date 1/22/2022 9:35:22 PM
Log SQL Server (Archive #1 - 1/23/2022 12:00:00 AM)
Source spid777
Message
A time-out occurred while waiting for buffer latch -- type 2, bp 0000016D7A1DE340, page 6:222, stat 0x40d, database id: 2, allocation unit Id: 536870912/281475513581568, task 0x0000016CD624E4E8 : 2, waittime 300 seconds, flags 0x1a, owning task 0x0000016CD624E4E8. Not continuing to wait.
BobMgr::GetBuf: Sort Big Output Buffer write not complete after 60 seconds.
DBCC CHECKDB (SentryOne) WITH all_errormsgs, no_infomsgs, maxdop = 4 executed by NT SERVICE\SQLSERVERAGENT terminated abnormally due to error state 6. Elapsed time: 12 hours 39 minutes 57 seconds.
[INFO] Database ID: . Cleaning up StorageArray. LastClosedCheckpointEndTs: '1225176490'
[WARNING] ALTER or DROP TABLE could not clean up root row within 10 seconds.PAGE: (6:222)
BUFFER:
BUF @0x0000016D6B622C40
bpage = 0x00000161A6C52000 bPmmpage = 0x0000000000000000 bsort_r_nextbP = 0x0000016D6B622AD0
bsort_r_prevbP = 0x0000016D6B622B80 bhash = 0x0000000000000000 bpageno = (6:222)
bpart = 4 ckptGen = 0x0000000000000000 bDirtyRefCount = 0
bstat = 0x9 breferences = 3 berrcode = 0
bUse1 = 19321 bstat2 = 0x0 blog = 0x215a215a
bsampleCount = 1 bIoCount = 0 resPoolId = 0
bcputicks = 330 bReadMicroSec = 848 bDirtyContext = 0x0000000000000000
bDbPageBroker = 0x0000000000000000 bdbid = 2 bpru = 0x0000016D3A170040
PAGE HEADER:
Page @0x00000161A6C52000
m_pageId = (6:222) m_headerVersion = 1 m_type = 10
m_typeFlagBits = 0x0 m_level = 0 m_flagBits = 0x200
m_objId (AllocUnitId.idObj) = 1837007664 m_indexId (AllocUnitId.idInd) = 28675
Metadata: AllocUnitId = 8071415347312328704
Metadata: PartitionId = 2162691495132069888 Metadata: IndexId = 0
Metadata: ObjectId = -1083263203 m_prevPage = (0:0) m_nextPage = (0:0)
pminlen = 90 m_slotCnt = 2 m_freeCnt = 6
m_freeData = 8182 m_reservedCnt = 0 m_lsn = (324:1435184:42)
m_xactReserved = 0 m_xdesId = (0:0) m_ghostRecCnt = 0
m_tornBits = -551517712 DB Frag ID = 1
Allocation Status
GAM (6:2) = ALLOCATED SGAM (6:3) = ALLOCATED
PFS (6:1) = 0x70 IAM_PG MIXED_EXT ALLOCATED 0_PCT_FULL DIFF (6:6) = NOT CHANGED
ML (6:7) = NOT MIN_LOGGED
IAM: Header @0x00000036C4278064 Slot 0, Offset 96
sequenceNumber = 0 status = 0x0 objectId = 0
indexId = 0 page_count = 0 start_pg = (8:511232)
IAM: Single Page Allocations @0x00000036C427808E
Slot 0 = (0:0) Slot 1 = (0:0) Slot 2 = (0:0)
Slot 3 = (0:0) Slot 4 = (0:0) Slot 5 = (0:0)
Slot 6 = (0:0) Slot 7 = (0:0)
IAM: Extent Alloc Status Slot 1 @0x00000036C42780C2
(8:511232) - (8:592656) = NOT ALLOCATED
(8:592664) - = ALLOCATED
(8:592672) - (8:770424) = NOT ALLOCATEDVM Cached IOPS Consumed Percentage and VM Cached Bandwidth Consumed Percentage.
Additional information:
- The server is installed on an Azure VM: Standard E8s v3 (8 vcpus, 64 GiB memory)
- The user database in question (SentryOne) has memory-optimized
tables.
- TempDB Memory-Optimized metadata is DISABLED.
- Instant File Initialization is ENABLED.
- Lock Pages in Memory is DISABLED.
Any ideas why this happened and how to prevent it in the future?
Thanks!
Asked by Eitan Blumin
(483 rep)
Jan 23, 2022, 11:44 AM
Last activity: Jan 23, 2022, 03:51 PM
Last activity: Jan 23, 2022, 03:51 PM