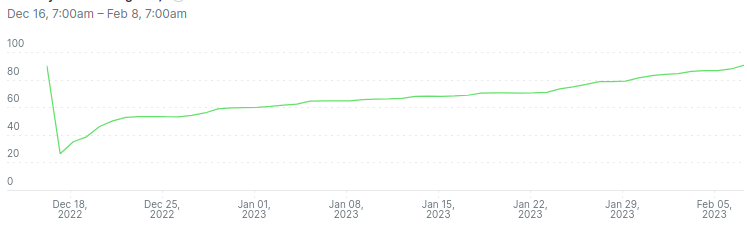
I have installed MySQL 8.0.29 on a dedicated server with 16 vCores and 60 GB RAM but the memory usage is still growing. I restarted the mysql service 2 months ago and it takes about 91% RAM now:
total        used        free      shared  buff/cache   available
Mem:           57Gi        51Gi       511Mi       2.0Mi       5.5Gi       5.3Gi
Swap: 0B 0B 0B[mysqld]
pid-file = /var/run/mysqld/mysqld.pid
socket = /var/run/mysqld/mysqld.sock
datadir = /var/lib/mysql
log-error = /var/log/mysql/error.log
bind-address = 10.10.0.2
server-id = 1
log_bin = /var/log/mysql/mysql-bin.log
binlog_expire_logs_seconds = 259200
binlog_do_db = dbname
skip_name_resolve = 1
innodb_dedicated_server = 1
max_allowed_packet = 536870912
max_connections = 1000
join_buffer_size = 1048576>> MySQLTuner 2.0.11
* Jean-Marie Renouard
* Major Hayden
>> Bug reports, feature requests, and downloads at http://mysqltuner.pl/
>> Run with '--help' for additional options and output filtering
[--] Skipped version check for MySQLTuner script
[OK] Currently running supported MySQL version 8.0.29-21
[OK] Operating on 64-bit architecture
-------- Log file Recommendations ------------------------------------------------------------------
[OK] Log file /var/log/mysql/error.log exists
[--] Log file: /var/log/mysql/error.log (300K)
[OK] Log file /var/log/mysql/error.log is not empty
[OK] Log file /var/log/mysql/error.log is smaller than 32 Mb
[OK] Log file /var/log/mysql/error.log is readable.
[!!] /var/log/mysql/error.log contains 2313 warning(s).
[!!] /var/log/mysql/error.log contains 1 error(s).
[--] 143 start(s) detected in /var/log/mysql/error.log
[--] 1) 2022-12-17T05:00:49.782964Z 0 [System] [MY-010931] [Server] /usr/sbin/mysqld: ready for connections. Version: '8.0.29-21' socket: '/var/run/mysqld/mysqld.sock' port: 3306 Percona Server (GPL), Release '21', Revision 'c59f87d2854'.
[--] 2) 2022-12-17T05:00:49.782926Z 0 [System] [MY-011323] [Server] X Plugin ready for connections. Bind-address: '::' port: 33060, socket: /var/run/mysqld/mysqlx.sock
[--] 3) 2022-12-07T05:25:48.429925Z 0 [System] [MY-010931] [Server] /usr/sbin/mysqld: ready for connections. Version: '8.0.29-21' socket: '/var/run/mysqld/mysqld.sock' port: 3306 Percona Server (GPL), Release '21', Revision 'c59f87d2854'.
[--] 4) 2022-12-07T05:25:48.429905Z 0 [System] [MY-011323] [Server] X Plugin ready for connections. Bind-address: '::' port: 33060, socket: /var/run/mysqld/mysqlx.sock
[--] 5) 2022-11-16T05:45:33.898403Z 0 [System] [MY-011323] [Server] X Plugin ready for connections. Bind-address: '::' port: 33060, socket: /var/run/mysqld/mysqlx.sock
[--] 6) 2022-11-16T05:45:33.896585Z 0 [System] [MY-010931] [Server] /usr/sbin/mysqld: ready for connections. Version: '8.0.29-21' socket: '/var/run/mysqld/mysqld.sock' port: 3306 Percona Server (GPL), Release '21', Revision 'c59f87d2854'.
[--] 7) 2022-10-19T12:55:01.812148Z 0 [System] [MY-010931] [Server] /usr/sbin/mysqld: ready for connections. Version: '8.0.29-21' socket: '/var/run/mysqld/mysqld.sock' port: 3306 Percona Server (GPL), Release '21', Revision 'c59f87d2854'.
[--] 8) 2022-10-19T12:55:01.811935Z 0 [System] [MY-011323] [Server] X Plugin ready for connections. Bind-address: '::' port: 33060, socket: /var/run/mysqld/mysqlx.sock
[--] 9) 2022-10-19T12:43:10.091727Z 0 [System] [MY-010931] [Server] /usr/sbin/mysqld: ready for connections. Version: '8.0.29-21' socket: '/var/run/mysqld/mysqld.sock' port: 3306 Percona Server (GPL), Release '21', Revision 'c59f87d2854'.
[--] 10) 2022-10-19T12:43:10.091690Z 0 [System] [MY-011323] [Server] X Plugin ready for connections. Bind-address: '::' port: 33060, socket: /var/run/mysqld/mysqlx.sock
[--] 16 shutdown(s) detected in /var/log/mysql/error.log
[--] 1) 2022-12-17T04:53:22.580264Z 0 [System] [MY-010910] [Server] /usr/sbin/mysqld: Shutdown complete (mysqld 8.0.29-21) Percona Server (GPL), Release '21', Revision 'c59f87d2854'.
[--] 2) 2022-12-07T05:24:48.272111Z 0 [System] [MY-010910] [Server] /usr/sbin/mysqld: Shutdown complete (mysqld 8.0.29-21) Percona Server (GPL), Release '21', Revision 'c59f87d2854'.
[--] 3) 2022-11-16T05:43:23.710144Z 0 [System] [MY-010910] [Server] /usr/sbin/mysqld: Shutdown complete (mysqld 8.0.29-21) Percona Server (GPL), Release '21', Revision 'c59f87d2854'.
[--] 4) 2022-10-15T23:45:59.932949Z 0 [System] [MY-010910] [Server] /usr/sbin/mysqld: Shutdown complete (mysqld 8.0.29-21) Percona Server (GPL), Release '21', Revision 'c59f87d2854'.
[--] 5) 2022-08-29T18:05:15.236277Z 0 [System] [MY-010910] [Server] /usr/sbin/mysqld: Shutdown complete (mysqld 8.0.29-21) Percona Server (GPL), Release '21', Revision 'c59f87d2854'.
[--] 6) 2022-08-29T16:07:59.235204Z 0 [System] [MY-010910] [Server] /usr/sbin/mysqld: Shutdown complete (mysqld 8.0.28-20) Percona Server (GPL), Release '20', Revision 'fd4b5a776a6'.
[--] 7) 2022-08-05T12:31:06.292042Z 0 [System] [MY-010910] [Server] /usr/sbin/mysqld: Shutdown complete (mysqld 8.0.28-20) Percona Server (GPL), Release '20', Revision 'fd4b5a776a6'.
[--] 8) 2022-07-29T13:58:25.716035Z 0 [System] [MY-010910] [Server] /usr/sbin/mysqld: Shutdown complete (mysqld 8.0.28-20) Percona Server (GPL), Release '20', Revision 'fd4b5a776a6'.
[--] 9) 2022-07-28T19:27:27.158294Z 0 [System] [MY-010910] [Server] /usr/sbin/mysqld: Shutdown complete (mysqld 8.0.28-20) Percona Server (GPL), Release '20', Revision 'fd4b5a776a6'.
[--] 10) 2022-07-27T21:26:21.431830Z 0 [System] [MY-010910] [Server] /usr/sbin/mysqld: Shutdown complete (mysqld 8.0.28-20) Percona Server (GPL), Release '20', Revision 'fd4b5a776a6'.
-------- Storage Engine Statistics -----------------------------------------------------------------
[--] Status: +ARCHIVE +BLACKHOLE +CSV -FEDERATED +InnoDB +MEMORY +MRG_MYISAM +MyISAM +PERFORMANCE_SCHEMA
[--] Data in InnoDB tables: 15.9G (Tables: 604)
[!!] Total fragmented tables: 1
-------- Analysis Performance Metrics --------------------------------------------------------------
[--] innodb_stats_on_metadata: OFF
[OK] No stat updates during querying INFORMATION_SCHEMA.
-------- Views Metrics -----------------------------------------------------------------------------
-------- Triggers Metrics --------------------------------------------------------------------------
-------- Routines Metrics --------------------------------------------------------------------------
-------- Security Recommendations ------------------------------------------------------------------
[--] Skipped due to unsupported feature for MySQL 8
-------- CVE Security Recommendations --------------------------------------------------------------
[OK] NO SECURITY CVE FOUND FOR YOUR VERSION
-------- Performance Metrics -----------------------------------------------------------------------
[--] Up for: 53d 5h 22m 49s (7B q [1K qps], 94M conn, TX: 57240G, RX: 6285G)
[--] Reads / Writes: 98% / 2%
[--] Binary logging is enabled (GTID MODE: OFF)
[--] Physical Memory : 57.5G
[--] Max MySQL memory : 547.0G
[--] Other process memory: 0B
[--] Total buffers: 44.0G global + 514.6M per thread (1000 max threads)
[--] Performance_schema Max memory usage: 400M
[--] Galera GCache Max memory usage: 0B
[!!] Maximum reached memory usage: 192.7G (335.17% of installed RAM)
[!!] Maximum possible memory usage: 547.0G (951.48% of installed RAM)
[!!] Overall possible memory usage with other process exceeded memory
[OK] Slow queries: 0% (0/7B)
[OK] Highest usage of available connections: 29% (295/1000)
[OK] Aborted connections: 0.00% (1/94397108)
[--] Query cache has been removed since MySQL 8.0
[OK] Sorts requiring temporary tables: 0% (11M temp sorts / 2B sorts)
[!!] Joins performed without indexes: 723947
[OK] Temporary tables created on disk: 0% (285K on disk / 412M total)
[OK] Thread cache hit rate: 99% (803K created / 94M connections)
[OK] Table cache hit rate: 99% (14B hits / 14B requests)
[OK] table_definition_cache (2000) is greater than number of tables (945)
[OK] Open file limit used: 0% (6/10K)
[OK] Table locks acquired immediately: 100% (131 immediate / 131 locks)
[OK] Binlog cache memory access: 98.13% (41213195 Memory / 41998131 Total)
-------- Performance schema ------------------------------------------------------------------------
[--] Performance_schema is activated.
[--] Memory used by Performance_schema: 400.6M
[--] Sys schema is installed.
-------- ThreadPool Metrics ------------------------------------------------------------------------
[--] ThreadPool stat is disabled.
-------- MyISAM Metrics ----------------------------------------------------------------------------
[--] MyISAM Metrics are disabled since MySQL 8.0.
-------- InnoDB Metrics ----------------------------------------------------------------------------
[--] InnoDB is enabled.
[--] InnoDB Thread Concurrency: 0
[OK] InnoDB File per table is activated
[OK] InnoDB buffer pool / data size: 44.0G / 15.9G
[!!] Ratio InnoDB log file size / InnoDB Buffer pool size (75%): 1.0G * 33 / 44.0G should be equal to 25%
[!!] InnoDB buffer pool instances: 8
[--] Number of InnoDB Buffer Pool Chunk: 352 for 8 Buffer Pool Instance(s)
[OK] Innodb_buffer_pool_size aligned with Innodb_buffer_pool_chunk_size & Innodb_buffer_pool_instances
[OK] InnoDB Read buffer efficiency: 100.00% (8303978165000 hits / 8303978910176 total)
[OK] InnoDB Write log efficiency: 96.33% (8325309995 hits / 8642424121 total)
[OK] InnoDB log waits: 0.00% (5 waits / 317114126 writes)
-------- Aria Metrics ------------------------------------------------------------------------------
[--] Aria Storage Engine not available.
-------- TokuDB Metrics ----------------------------------------------------------------------------
[--] TokuDB is disabled.
-------- XtraDB Metrics ----------------------------------------------------------------------------
[--] XtraDB is disabled.
-------- Galera Metrics ----------------------------------------------------------------------------
[--] Galera is disabled.
-------- Replication Metrics -----------------------------------------------------------------------
[--] Galera Synchronous replication: NO
[--] No replication slave(s) for this server.
[--] Binlog format: ROW
[--] XA support enabled: ON
[--] Semi synchronous replication Master: Not Activated
[--] Semi synchronous replication Slave: Not Activated
[--] This is a standalone server
-------- Recommendations ---------------------------------------------------------------------------
General recommendations:
Check warning line(s) in /var/log/mysql/error.log file
Check error line(s) in /var/log/mysql/error.log file
Run ALTER TABLE ... FORCE or OPTIMIZE TABLE to defragment tables for better performance
ALTER TABLE magento.mageplaza_smtp_log FORCE; -- can free 2024 MiB
Total freed space after defragmentation : 2024 MiB
Reduce your overall MySQL memory footprint for system stability
Dedicate this server to your database for highest performance.
We will suggest raising the 'join_buffer_size' until JOINs not using indexes are found.
See https://dev.mysql.com/doc/internals/en/join-buffer-size.html
(specially the conclusions at the bottom of the page).
Buffer Key MyISAM set to 0, no MyISAM table detected
Before changing innodb_log_file_size and/or innodb_log_files_in_group read this: https://bit.ly/2TcGgtU
Variables to adjust:
*** MySQL's maximum memory usage is dangerously high ***
*** Add RAM before increasing MySQL buffer variables ***
join_buffer_size (> 1.0M, or always use indexes with JOINs)
key_buffer_size=0
innodb_log_file_size should be (=341M) if possible, so InnoDB total log files size equals 25% of buffer pool size.
innodb_buffer_pool_instances(=44)mysql> SHOW STATUS WHERE variable_name = 'Max_used_connections';
+----------------------+-------+
| Variable_name | Value |
+----------------------+-------+
| Max_used_connections | 295 |
+----------------------+-------+
1 row in set (0.01 sec)
mysql> SHOW STATUS WHERE variable_name like 'Threads_%';
+-------------------+--------+
| Variable_name | Value |
+-------------------+--------+
| Threads_cached | 10 |
| Threads_connected | 47 |
| Threads_created | 804042 |
| Threads_running | 8 |
+-------------------+--------+
4 rows in set (0.00 sec)
Asked by deem
(113 rep)
Feb 8, 2023, 10:30 AM
Last activity: Feb 9, 2023, 08:42 AM
Last activity: Feb 9, 2023, 08:42 AM