Optimize queries to track trading algorithm performance
0
votes
0
answers
66
views
I have a panel where a user can upload Python trading algorithms acting on the Binance API and track the performance of each algorithm in e.g a chart like this:
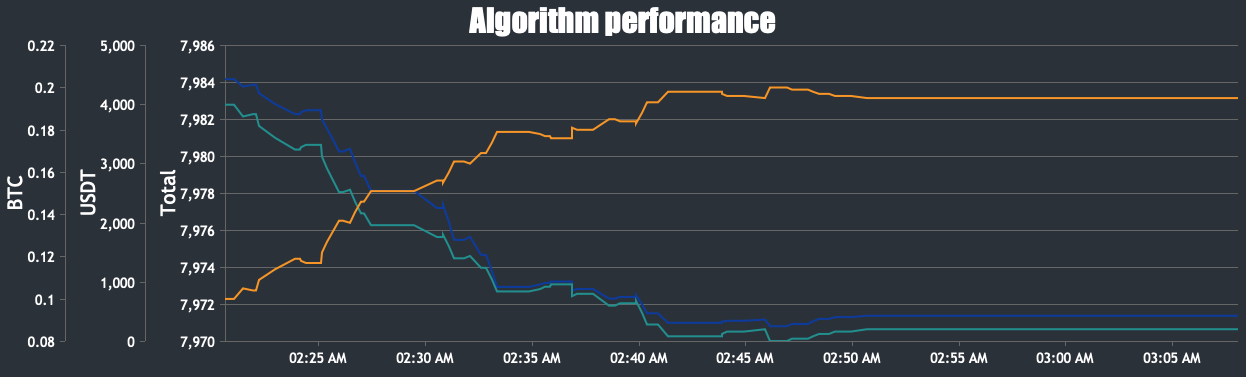 For each algorithm the amount of BTC, USDT and the total funds (USDT + BTC * actual_btc_price) are displayed.
To achieve this I have the following tables.
**algorithms** - Holding all the algorithms and their configuration.
For each algorithm the amount of BTC, USDT and the total funds (USDT + BTC * actual_btc_price) are displayed.
To achieve this I have the following tables.
**algorithms** - Holding all the algorithms and their configuration.
For each algorithm the amount of BTC, USDT and the total funds (USDT + BTC * actual_btc_price) are displayed.
To achieve this I have the following tables.
**algorithms** - Holding all the algorithms and their configuration.
Table "public.algorithms"
      Column      |          Type          | Collation | Nullable |         Default
------------------+------------------------+-----------+----------+-------------------------
 id               | character varying(255) |           | not null |
 description      | character varying(512) |           | not null |
 start_funds_usdt | numeric                |           | not null | 0.00
 interval         | character varying(3)   |           | not null | '1s'::character varying
 run_every_sec    | integer                |           | not null | 0
 user_id          | integer                |           | not null |
Indexes:
    "algorithms_pkey" PRIMARY KEY, btree (id)
Referenced by:
    TABLE "_timescaledb_internal._hyper_4_1_chunk" CONSTRAINT "1_1_history_algorithm_id_fkey" FOREIGN KEY (algorithm_id) REFERENCES algorithms(id) ON DELETE CASCADE
TABLE "history" CONSTRAINT "history_algorithm_id_fkey" FOREIGN KEY (algorithm_id) REFERENCES algorithms(id) ON DELETE CASCADETable "public.history"
Column | Type | Collation | Nullable | Default
--------------+-----------------------------+-----------+----------+-------------------------
algorithm_id | character varying(255) | | not null |
order_id | character varying(12) | | | NULL::character varying
action | character varying(5) | | | NULL::character varying
btc | numeric | | not null |
usdt | numeric | | not null |
btc_price | numeric | | not null |
created_at | timestamp without time zone | | not null | CURRENT_TIMESTAMP
Indexes:
"history_created_at_idx" btree (created_at DESC)
Foreign-key constraints:
"history_algorithm_id_fkey" FOREIGN KEY (algorithm_id) REFERENCES algorithms(id) ON DELETE CASCADE
Triggers:
ts_insert_blocker BEFORE INSERT ON history FOR EACH ROW EXECUTE FUNCTION _timescaledb_functions.insert_blocker()
Number of child tables: 1 (Use \d+ to list them.)# {} is the current btc_price retrieved by the Binance API.
DO
$$
declare f record;
begin
for f in SELECT DISTINCT id from algorithms
loop
insert into history(algorithm_id, btc, usdt, btc_price) values (f.id, 0.0, 0.00, {});
end loop;
end
$$;history even if a order was not made on that minute.
The following issue was that my initial approach was slow: I took the first timestamp available in history for a given algorithm, add a minute to that one until the current time is reached, and in that loop summed all the values of the columns USDT and BTC where the created_at value was lower then the timestamp in the loop.
This was incredibly slow. I solved it by making a view called **history_aggregate**.
CREATE MATERIALIZED VIEW history_aggregate AS
SELECT
    created_at,
    algorithm_id,
    SUM(usdt) OVER (PARTITION BY algorithm_id ORDER BY created_at) AS total_usdt,
    SUM(btc) OVER (PARTITION BY algorithm_id ORDER BY created_at) as total_btc
FROM
    history
GROUP BY
algorithm_id, history.btc, history.btc_price, history.usdt, history.created_at;WITH btc_price_cte AS (
SELECT btc_price FROM history where algorithm_id = $1 ORDER BY created_at DESC LIMIT 1
)
SELECT
start_funds_usdt + COALESCE(h.total_usdt, 0) + COALESCE(h.total_btc * btc_price_cte.btc_price, 0) AS current_funds_total,
start_funds_usdt + COALESCE(h.total_usdt, 0) AS current_funds_usdt,
COALESCE(h.total_btc, 0) AS current_funds_btc,
h.created_at::TEXT AS ts
FROM
algorithms
LEFT JOIN
history_aggregate h ON h.algorithm_id = algorithms.id
CROSS JOIN
btc_price_cte
WHERE
algorithms.id = $1
GROUP BY
algorithm_id, start_funds_usdt, h.total_usdt, h.total_btc, btc_price_cte.btc_price, h.created_at
ORDER BY h.created_at;
Asked by O'Niel
(61 rep)
Jan 24, 2024, 02:23 AM
Last activity: Jan 27, 2024, 01:38 AM
Last activity: Jan 27, 2024, 01:38 AM