Performance issues of a queue implemented on top of InnoDB
3
votes
4
answers
285
views
# Brief problem statement
First thing first: _after_ posting this question originally and working more with our DBAs, I actually learned that our DB runs in a container, instead of being installed natively. From what I've read before, it's discouraged to do that in prod, since databases do all sorts of microoptimizations with memory and storage and cpu, and the container might obscure some things and so the behavior will not be optimal. So, if after reading this question you think it can be actually caused by the DB running in a container, definitely lmk.
Alright so now to the actual question:
-------
There will be a detailed explanation below, but this initial problem statement is just to give you a feel of what we’re dealing with here.
We have a feature called “Tasks”, which is just a generic task runner. A task is represented by a single row in an InnoDB table (using MariaDB 10.6.14); anyone can create a task, and then one of the workers will pick it up, run, potentially retry a few times if there are errors, and once the task is finished (successfully or not), delete the row from the table.
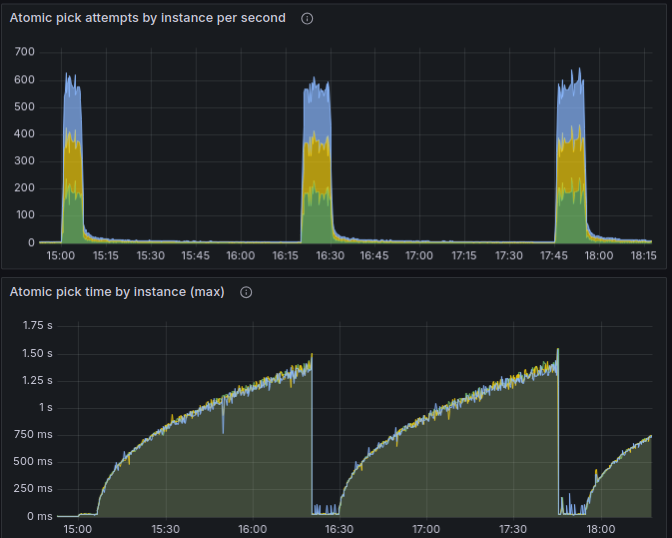
The issue is that, having plenty of tasks to run (even just 200K of runnable tasks which we need to run asap is enough), the performance alternates between those two modes:
- Performance is great (the query to pick the next task takes 20-30ms, and every worker is able to run about 200 tasks per second or more)
- Performance is terrible (the query quickly jumps to hundreds of milliseconds, and keeps slowly growing, and we’re running 1-3 tasks per second per worker).
The “great” phase usually lasts for 5-10 mins, followed by a few hours of the “terrible” phase; then it fixes itself and goes back to “great”, etc.
Here’s how it looks on the charts:
 A few quick points to highlight:
- On this chart, no new tasks are being inserted in the table; we already have a few hundred K of tasks in the table that we need to run ASAP, and as we run them (and
A few quick points to highlight:
- On this chart, no new tasks are being inserted in the table; we already have a few hundred K of tasks in the table that we need to run ASAP, and as we run them (and 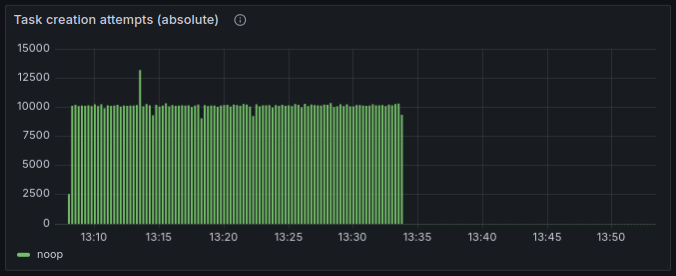
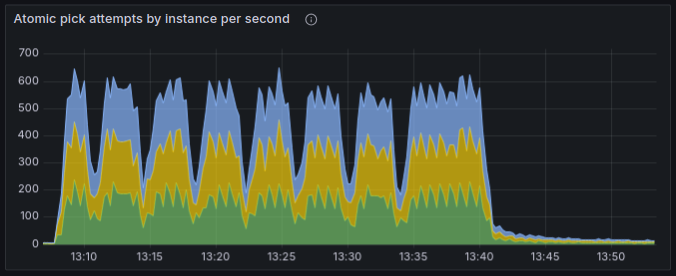
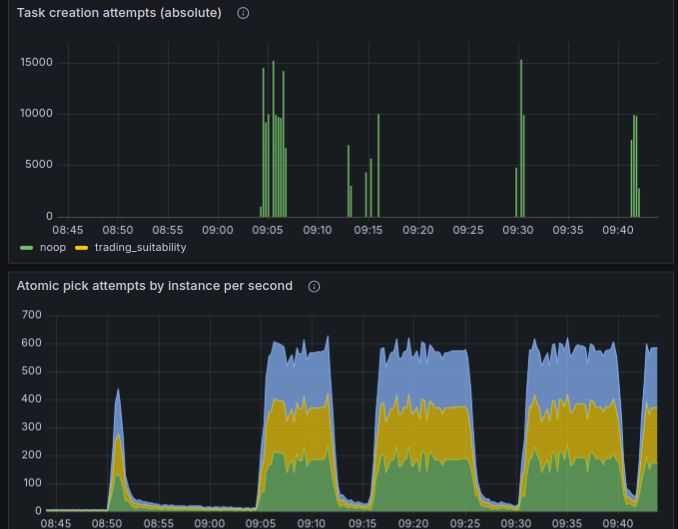
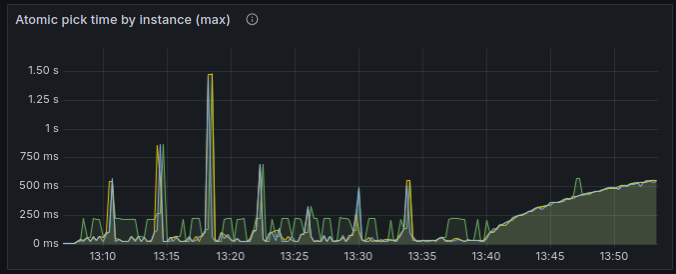 - So while we’re inserting tasks, it doesn't go into the degraded state for too long;
- Instead, there is a distinctive pattern: seemingly every 4 mins, the performance drops, and then immediately recovers.
- When we stopped creating tasks, it worked for a few minutes, and again fell into a degraded state for an extended period of time.
I also confirmed that by just waiting for it to degrade, and then inserting a bunch of tasks, to check if it’d help it to recover. It helped every time. Empirically found that inserting 10K or 20K is not enough, but 30K of tasks is usually enough; the performance recovers right after inserting enough tasks:
- So while we’re inserting tasks, it doesn't go into the degraded state for too long;
- Instead, there is a distinctive pattern: seemingly every 4 mins, the performance drops, and then immediately recovers.
- When we stopped creating tasks, it worked for a few minutes, and again fell into a degraded state for an extended period of time.
I also confirmed that by just waiting for it to degrade, and then inserting a bunch of tasks, to check if it’d help it to recover. It helped every time. Empirically found that inserting 10K or 20K is not enough, but 30K of tasks is usually enough; the performance recovers right after inserting enough tasks:
 I guess it tells me that frequent
A few quick points to highlight:
- On this chart, no new tasks are being inserted in the table; we already have a few hundred K of tasks in the table that we need to run ASAP, and as we run them (and DELETE the rows from the table), the performance alternates like that.
- It doesn’t seem to have anything to do with the amount of data in the table: as mentioned, even just 200K of rows is enough, which is nothing for the modern hardware (and yeah the hardware specs used here are very good). It’s rather just the velocity of changes that seems to be causing this: those 200K of rows represent the tasks that we need to run ASAP, and we do. When we have a much lower rate of tasks that we delete/update, those performance issues don’t happen.
- It doesn’t seem to be caused by a wrong index: if there wasn’t a proper index, the performance would always be bad. But here it switches back and forth on its own, without us adding any new data to the table, so it seems to be some internal mariadb issues.
This was just to give you a feel of what the issue is like. I have more to say on this, but before I do that, I feel I need to share more implementation details, so let’s get to it.
# Background info and implementation details
As mentioned above, we have a generic task runner. A task is represented by a single row in an InnoDB table; anyone can create a task, and then one of the workers will pick it up, take care of, and eventually delete the row from the table.
There are two additional features worth highlighting:
- A task can be scheduled either to run ASAP or after a specific time in the future; the only time-related guarantee here is that the task will not run before its scheduled time. We say that a task is runnable if we don’t need to wait more and can already run it whenever we can;
- Every task has a priority: from 0 (highest) to 4 (lowest); having multiple runnable tasks on different priorities, the higher-priority tasks will always be picked first.
Btw those features are a big part of why this was implemented on top of MariaDB, and not say Kafka or similar. It’s not a textbook use case of Kafka.
The usage pattern can be very bursty: most of the time we might have like 10-20 tasks per second being created and ran ASAP, and it doesn’t cause problems; but then as part of some batch job we might create a few millions of low-priority tasks, and the workers will run them at the rate of 500 tasks per second in total.
This is how the table looks like (there are a bit more fields, but they are not relevant to the problem, so are omitted)
CREATE TABLE tasks (
  id bigint(20) unsigned NOT NULL AUTO_INCREMENT,

  -- Identifies which handler to actually run for this task. Think of it
  -- as the name of a function to call.
  name varchar(127) NOT NULL,

  -- Priority of the task; the highest priority is 0, and as the number
  -- increases, priority lowers. Currently, it can be from 0 to 4.
  priority tinyint(3) unsigned NOT NULL DEFAULT 2,

  -- Status of the task, one of those:
  -- - 0: PENDING: the task is ready to run asap or after next_attempt time.
  --      It can be the initial status that the task is created with, but the
  --      task could also reenter this status again later if it failed and the
  --      scheduler decided to retry it;
  -- - 1: PROCESSING: the task is currently being executed;
  --
  -- Note: there are no states for completed or failed tasks, because such
  -- tasks are deleted from this table.
  status tinyint(3) unsigned NOT NULL DEFAULT 0,

  -- Specifies the earliest time when the task needs to run next time.
  -- Used for tasks scheduled for the future, as well as for implementing
  -- retries with backoff. If NULL, the task should run ASAP.
  next_attempt timestamp(6) NULL,

  PRIMARY KEY (id),

  -- See details on this particular index ordering below.
  INDEX tasks_next_attempt_id_idx (priority, next_attempt, id)
) ENGINE=InnoDB AUTO_INCREMENT=1 DEFAULT CHARSET=utf8;next_attempt to the current time plus 15 seconds (which is an interval after which the task will rerun if it appears dead; it’s not really relevant to the problem, but for the context: while the task is running, every 10 seconds its next_attempt will be again updated to 15 seconds into the future, so as long as the worker is functioning and the task keeps running, next_attempt will always be in the future)
- Return the task id
Here’s the exact query (where 2024-04-11 08:00:00 used as the current time: we actually pass specific timestamps like that instead of using NOW() for better testability, but it’s not related to the issue).
UPDATE tasks
INNER JOIN (
    SELECT id FROM tasks
    WHERE
            priority IN (0, 1, 2, 3, 4)
        AND (next_attempt IS NULL OR next_attempt = 0 AND priority  select count(*) from tasks;
+----------+
| count(*) |
+----------+
|        0 |
+----------+
1 row in set (0.3 sec)

mysql> SELECT id FROM tasks WHERE priority IN (0, 1, 2, 3, 4) AND (next_attempt IS NULL OR next_attempt  EXPLAIN SELECT id FROM tasks WHERE priority IN (0, 1, 2, 3, 4) AND (next_attempt IS NULL OR next_attempt <= NOW()) ORDER BY priority, next_attempt, id LIMIT 1 FOR UPDATE SKIP LOCKED;
+------+-------------+----------+-------+---------------------------------------+---------------------------------------+---------+------+--------+--------------------------+
| id   | select_type | table    | type  | possible_keys                         | key                                   | key_len | ref  | rows   | Extra                    |
+------+-------------+----------+-------+---------------------------------------+---------------------------------------+---------+------+--------+--------------------------+
|    1 | SIMPLE      | tasks    | range | tasks_priority_next_attempt_id_idx    | tasks_priority_next_attempt_id_idx    | 9       | NULL | 748746 | Using where; Using index |
+------+-------------+----------+-------+---------------------------------------+---------------------------------------+---------+------+--------+--------------------------+
1 row in set (0.26 sec)SHOW TABLE STATUS, the important bits from there are:
Data_length:    45 092 864
Index_length:    7 393 280
Data_free: 827 326 464Data_length: 4 096
Index_length: 4 096
Data_free: 879 755 264DELETE the tasks, but only UPDATE them to make them non-runnable, it doesn’t help with the performance
I was just suspecting that the fragmentation (which is supposedly caused by deleting a lot of data from the table) might have something to do with it, so I just changed the logic to UPDATE the task after completion (set it to lowest the priority 5 which is never runnable) instead of DELETEing the row. It didn’t change anything about the performance; the patterns remained the same.
## 3. Doing a bunch of INSERTs helps
As another observation, when we not only run tasks (and therefore DELETE them from the table), but also INSERT new tasks at about the same rate, then even though mariadb still switches to poor performance periodically, it recovers very quickly. Check it out:
- So while we’re inserting tasks, it doesn't go into the degraded state for too long;
- Instead, there is a distinctive pattern: seemingly every 4 mins, the performance drops, and then immediately recovers.
- When we stopped creating tasks, it worked for a few minutes, and again fell into a degraded state for an extended period of time.
I also confirmed that by just waiting for it to degrade, and then inserting a bunch of tasks, to check if it’d help it to recover. It helped every time. Empirically found that inserting 10K or 20K is not enough, but 30K of tasks is usually enough; the performance recovers right after inserting enough tasks:
I guess it tells me that frequent INSERTs cause MariaDB to do something useful with the index, while frequent DELETEs and UPDATEs unfortunately do not.
## 4. Rebuilding an index helps
If we just build a new index and drop the old one:
ALTER TABLE tasks ADD INDEX tasks_next_attempt_id_idx2 (priority,next_attempt,id), ALGORITHM=INPLACE, LOCK=NONE;

ALTER TABLE tasks DROP INDEX tasks_next_attempt_id_idx;ALTER TABLE in the app code, but practically it’s still much better than letting it be in the degraded state for hours.
# Question
I’d appreciate any thoughts and feedback you have based on the explanation above, but the questions I'm actually asking are:
## 1. What is happening?
Really curious to learn some MariaDB implementation details which would explain this behavior, since it doesn’t make sense to me and I wasn’t able to find it on my own.
## 2. How to make it work fast without having to rebuild the index manually?
As mentioned before, doing a bunch of INSERTs, like 30K or more, usually helps it to recover from the degraded state, so it looks like MariaDB does some maintenance to the index behind the scenes, and this maintenance doesn’t happen for DELETEs or UPDATEs. I wonder if there is some knob in MariaDB that we can tune to enable some more aggressive index maintenance, without having to rebuild it manually.
Asked by Dmitry Frank
(131 rep)
Apr 12, 2024, 09:35 AM
Last activity: May 31, 2025, 04:05 PM
Last activity: May 31, 2025, 04:05 PM