High CPU utilization on an idle SQL Server instance without user traffic
0
votes
1
answer
221
views
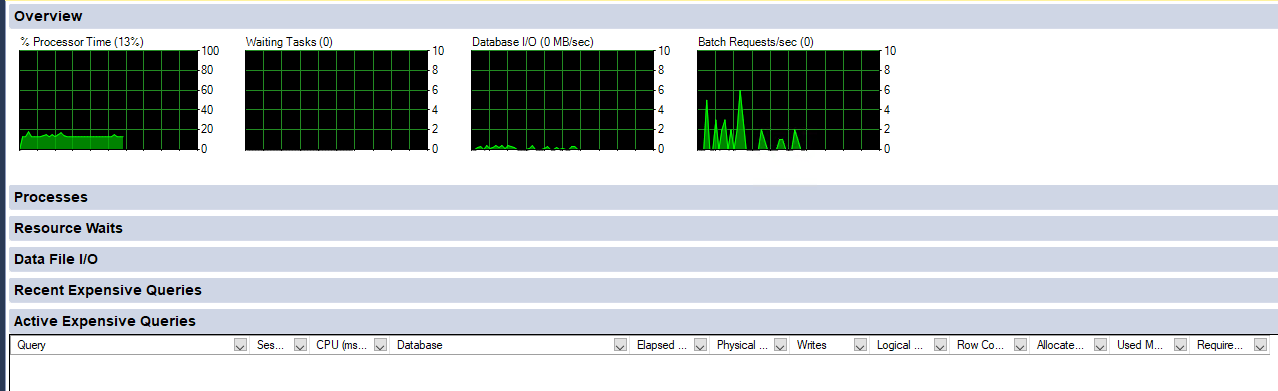
We have an SQL Server 2022 CU13 Enterprise on a Windows 2022 VM with 8 vCPU. The sqlserver.exe process shows a high CPU utilization between 10-15% even when there is no user generated load (meaning there is no user connection at the moment, even the SQL Server Agent is stopped to eliminate all non-system load) on the server. The dominant wait type is SOS_SCHEDULER_YELD at that idle time.
This server activity also blocks the SQL Server service to be stopped. An attempt to stop the service results in an endless waiting and the Windows service process needs to be killed so that it "stops". After the restart the utilization is perfectly fine for some time (the idle server has */- 0 cpu utilization), but after some period of time (a few hours or a few days maximum) with the user load running the issue is back again. Meaning the utilization is higher than it should be with the user load generated and again, after the load is stopped (no user connections) the utilization remains high as mentioned above...
There are no suspicious messages in the error log, XE health session, Windows event log...
Here is the view to the Activity Monitor on the server in during the above described idle period:
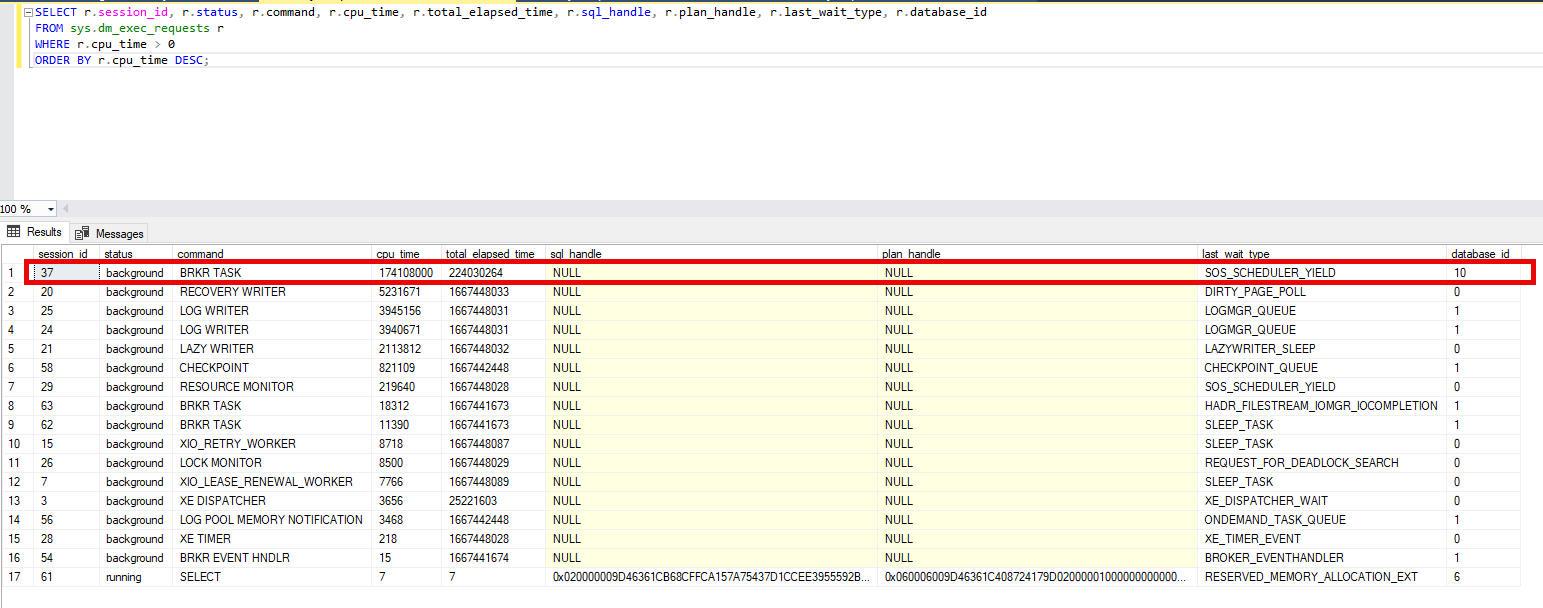
 After some investigation I likely identified the SPID, that causes this utilization. It seems to be a system SPID (SPID 37 at the time of the investigation) and it consumes about 10 seconds of cpu time over 10 seconds period (see the output from the Query 4 below). The database_id for the SPID seems to be changing between master (database_id = 1) and one of the user databases (database_id = 10). Only databases id 1 and 10 seems to be involved in this SPID activity. The SPID is also generating an ever increasing allocation in the tempdb (see the output from the Query 3 below).
Here is the output from the sys.dm_exec_request at the same time as the Activity Monitor picture above has been taken (the problematic spid is the 37):
After some investigation I likely identified the SPID, that causes this utilization. It seems to be a system SPID (SPID 37 at the time of the investigation) and it consumes about 10 seconds of cpu time over 10 seconds period (see the output from the Query 4 below). The database_id for the SPID seems to be changing between master (database_id = 1) and one of the user databases (database_id = 10). Only databases id 1 and 10 seems to be involved in this SPID activity. The SPID is also generating an ever increasing allocation in the tempdb (see the output from the Query 3 below).
Here is the output from the sys.dm_exec_request at the same time as the Activity Monitor picture above has been taken (the problematic spid is the 37):
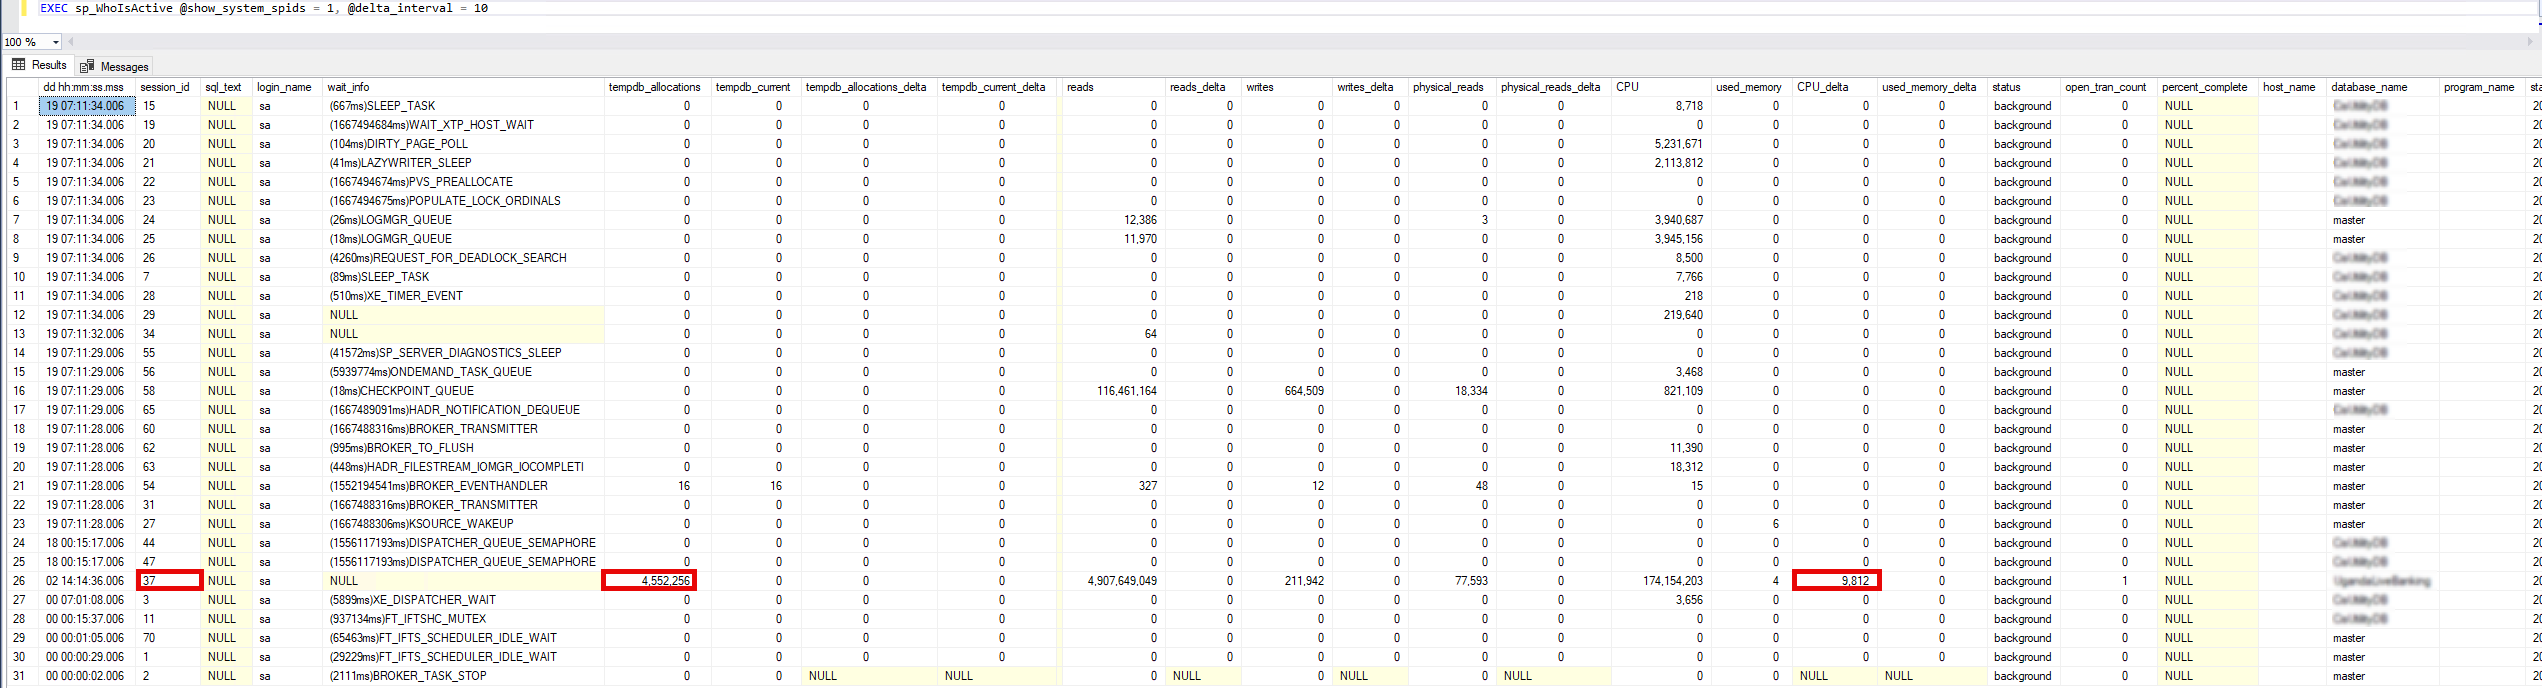
 Here is the output from sp_WhoIsActive at the same time:
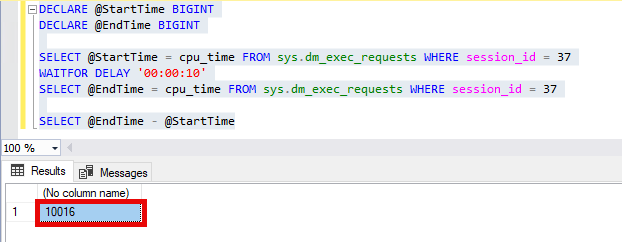
 Here is a calculation of consumed cpu time for the SPID over the 10 seconds period:
 As I understand it, it seems to be a Service Broker activity. However, there is neither Service Broker enabled in the master nor in the user database. We do not actively use the Service Broker in our databases. I have no idea, what this broker activity could be about and with what system activity it could be connected. There is no any "unusual" feature used either on the server or in that user database, just a "basic common features set", the only "unusual feature" is the TDE enabled.
Any idea about how I can further investigate the root cause for this issue (what is this broker activity about) and how I can get rid of it?
As I understand it, it seems to be a Service Broker activity. However, there is neither Service Broker enabled in the master nor in the user database. We do not actively use the Service Broker in our databases. I have no idea, what this broker activity could be about and with what system activity it could be connected. There is no any "unusual" feature used either on the server or in that user database, just a "basic common features set", the only "unusual feature" is the TDE enabled.
Any idea about how I can further investigate the root cause for this issue (what is this broker activity about) and how I can get rid of it?
After some investigation I likely identified the SPID, that causes this utilization. It seems to be a system SPID (SPID 37 at the time of the investigation) and it consumes about 10 seconds of cpu time over 10 seconds period (see the output from the Query 4 below). The database_id for the SPID seems to be changing between master (database_id = 1) and one of the user databases (database_id = 10). Only databases id 1 and 10 seems to be involved in this SPID activity. The SPID is also generating an ever increasing allocation in the tempdb (see the output from the Query 3 below).
Here is the output from the sys.dm_exec_request at the same time as the Activity Monitor picture above has been taken (the problematic spid is the 37):
Here is the output from sp_WhoIsActive at the same time:
Here is a calculation of consumed cpu time for the SPID over the 10 seconds period:
As I understand it, it seems to be a Service Broker activity. However, there is neither Service Broker enabled in the master nor in the user database. We do not actively use the Service Broker in our databases. I have no idea, what this broker activity could be about and with what system activity it could be connected. There is no any "unusual" feature used either on the server or in that user database, just a "basic common features set", the only "unusual feature" is the TDE enabled.
Any idea about how I can further investigate the root cause for this issue (what is this broker activity about) and how I can get rid of it?
Asked by Martin Karouš
(508 rep)
Jul 16, 2024, 09:00 PM
Last activity: Jul 30, 2024, 01:04 PM
Last activity: Jul 30, 2024, 01:04 PM