SQL Server 2022 very slow comparing to SQL 2014/2017 same query
-1
votes
1
answer
75
views
I have a big problem with performance in SQL 2022 on windows 2025. I do not know which is bigger issue windows or SQL.
Some background. We are using **Proxmox** as Hypervisor.
- HOST1 - DELL PowerEdge R7625, 2xAMD EPYC 9174F 4,10GHz, 1TB RAM, 16x64GB RAM RDIMM 4800MT/s, DISKS 6x1.6TB NVMe Gen4 dysk AG U.2 Enterprise
- VM1 - Windows 2025, SQL 2022 socket-2, vCores 16, RAM 256 GB
- HOST2 - Huawei 2488h-v5, 2 x Intel® Xeon® Gold 6244 3.6G, 512 GB RAM DDR4 - RDIMM 2933MT/s, DISKS - 5x1.9 GB NVMe
- VM2 - Windows 2012R2 - multi instance SQL 2014, SQL 2017 socket-2, vCores 6, RAM 256 GB
- VM3 - Windows 2019 - multi instance SQL 2017, SQL 2019, SQL 2022 socket-2, vCores 8, RAM 256 GB
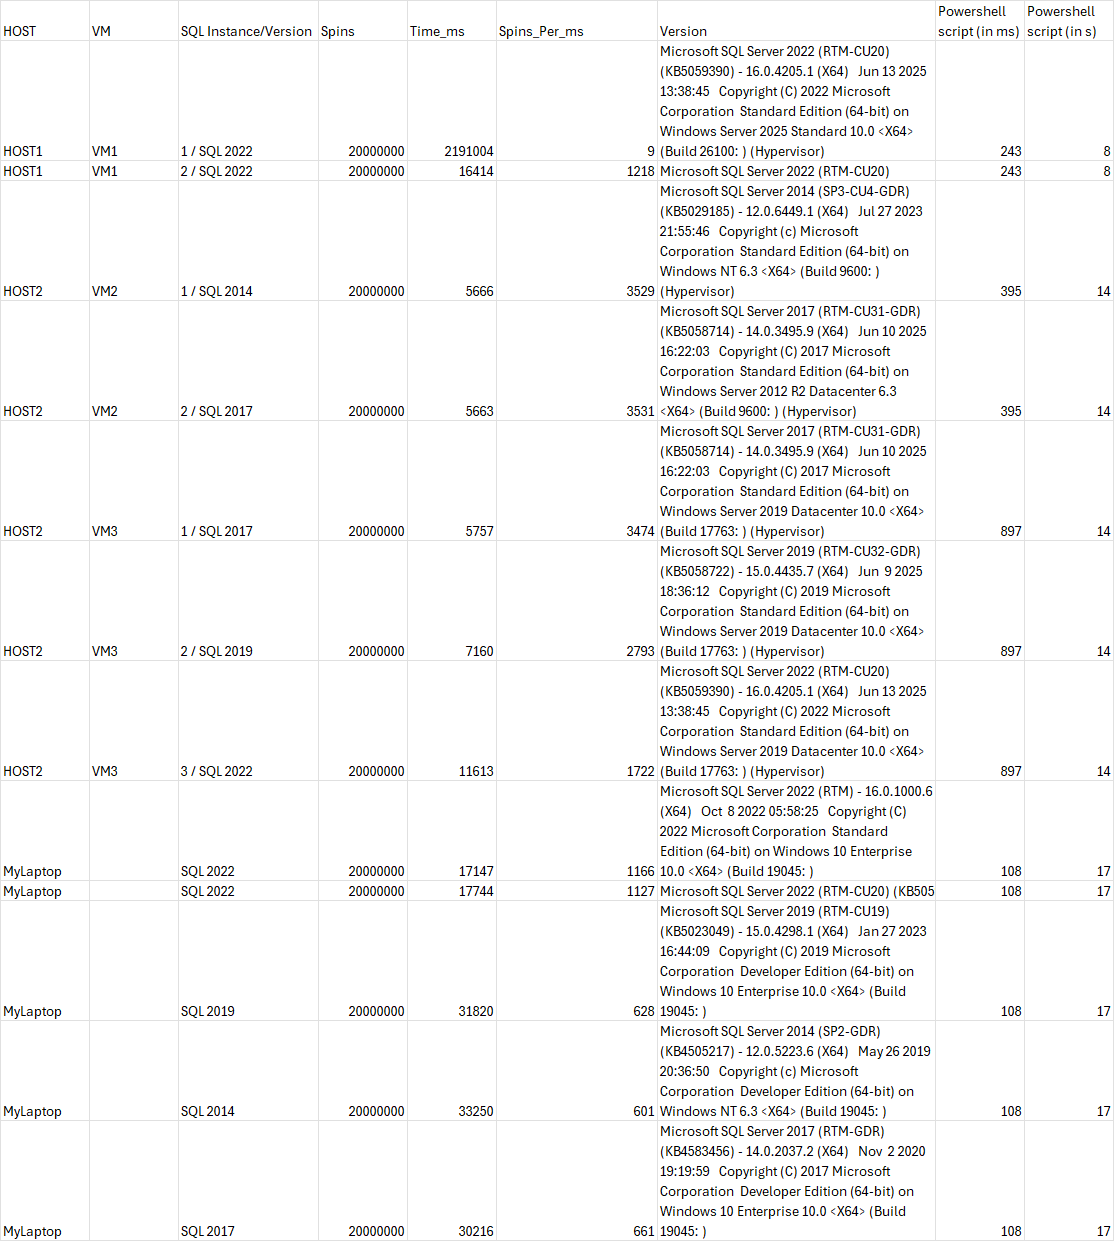
I have one query which shows that theres is sth wrong with
What I have tried:
- Comparison between other windows and sql versions and different hardware several queries
- I have excluded hardware problem - tested same VM on different hosts
Analyzing configuration on hardware, hypervisor, OS and SQL level
- I have analyzed several queries which runs slower and they had all in common waits like MEMORY_ALLOCATION_EXT and i see this on this VM1, but o do not see those on VM2, VM3
- I have moved VM1 to Host2 to see if it helps - it didn't 6 I Have moved VM2 to Host 1 to see if it breaks sth ;) it didn't
- I came to one conclusion that the problem is in SQL2022 on Windows 2022.
**VM1 - SQL 2022** is always slow on all queries which has loops, cursors, large memory grants.
I found this https://learn.microsoft.com/en-us/troubleshoot/sql/database-engine/performance/troubleshoot-query-perf-between-servers#diagnose-environment-differences
And started to analyze this problem with this query only
SET NOCOUNT ON
DECLARE @spins INT = 0
DECLARE @start_time DATETIME = GETDATE(), @time_millisecond INT
WHILE (@spins < 20000000)
BEGIN
SET @spins = @spins +1
END
SELECT @time_millisecond = DATEDIFF(millisecond, @start_time, getdate())
SELECT @spins Spins, @time_millisecond Time_ms, @spins / @time_millisecond Spins_Per_ms
I added some powershell scripts also
$bf = [System.DateTime]::Now
for ($i = 0; $i -le 20000000; $i++) {}
$af = [System.DateTime]::Now
Write-Host ($af - $bf).Milliseconds " milliseconds"
Write-Host ($af - $bf).Seconds " Seconds"
What i found was that this query runs significantly different on different enviroment :(
Table of comparison:
 Using Brent's Ozar SP_BlitzFirst procedures
EXEC master.dbo.sp_BlitzFirst @expertmode = 1
It showed that this session which is waiting its waits is SOS_SCHEDULER_YIELD (16133 ms)
But when i run
SELECT TOP 10
wait_type,
wait_time_ms / 1000.0 AS wait_time_sec,
100.0 * wait_time_ms / SUM(wait_time_ms) OVER() AS pct,
signal_wait_time_ms / 1000.0 AS signal_wait_time_sec,
waiting_tasks_count
FROM sys.dm_os_wait_stats
WHERE wait_type NOT IN ('SLEEP_TASK', 'BROKER_TASK_STOP', 'BROKER_TO_FLUSH',
'SQLTRACE_BUFFER_FLUSH', 'XE_DISPATCHER_WAIT', 'XE_TIMER_EVENT')
ORDER BY waiting_tasks_count DESC, wait_time_ms DESC;
It shows that on this server I have problem with to many tasks wating for MEMORY_ALLOCATION_EXT RESERVED_MEMORY_ALLOCATION_EXT
I tried to change VM1 to 24 processors to test this in VM if it will help but it does not help.
If I look at percentage of waits whish is most common I see 87 % of SOS_SCHEDULER_YIELD, but it must be something else because it yields because of something :( Memory ?
I will test new VMs with WS 2025, SQL2022 and WS2022 and SQL2022, WS2025 and SQL2019 to test how it acts.
Using Brent's Ozar SP_BlitzFirst procedures
EXEC master.dbo.sp_BlitzFirst @expertmode = 1
It showed that this session which is waiting its waits is SOS_SCHEDULER_YIELD (16133 ms)
But when i run
SELECT TOP 10
wait_type,
wait_time_ms / 1000.0 AS wait_time_sec,
100.0 * wait_time_ms / SUM(wait_time_ms) OVER() AS pct,
signal_wait_time_ms / 1000.0 AS signal_wait_time_sec,
waiting_tasks_count
FROM sys.dm_os_wait_stats
WHERE wait_type NOT IN ('SLEEP_TASK', 'BROKER_TASK_STOP', 'BROKER_TO_FLUSH',
'SQLTRACE_BUFFER_FLUSH', 'XE_DISPATCHER_WAIT', 'XE_TIMER_EVENT')
ORDER BY waiting_tasks_count DESC, wait_time_ms DESC;
It shows that on this server I have problem with to many tasks wating for MEMORY_ALLOCATION_EXT RESERVED_MEMORY_ALLOCATION_EXT
I tried to change VM1 to 24 processors to test this in VM if it will help but it does not help.
If I look at percentage of waits whish is most common I see 87 % of SOS_SCHEDULER_YIELD, but it must be something else because it yields because of something :( Memory ?
I will test new VMs with WS 2025, SQL2022 and WS2022 and SQL2022, WS2025 and SQL2019 to test how it acts.
Asked by Alfar
(9 rep)
Jul 14, 2025, 06:05 AM
Last activity: Jul 15, 2025, 06:42 PM
Last activity: Jul 15, 2025, 06:42 PM