rsyslogd eating up 20+ GB (!) of RAM - what evidence to gather?
11
votes
2
answers
12613
views
I have a Ubuntu 14.04.3 box running kernel 3.13.0-74 with 32GB RAM, which features a rsyslogd process gone mad:
$ ps -auxww | grep rsyslog
syslog 16212 0.7 64.0 27966168 21070336 ? Ssl Jan04 180:31 rsyslogd -c 5 -x
$ free -m
total used free shared buffers cached
Mem: 32142 31863 278 228 9 363
-/+ buffers/cache: 31490 651
Swap: 16383 11937 4446
I know ps' output cannot be fully relied on etc but surely that's a bit high! I also have two sibling machines with the same s/w (running since the same time) and on both siblings, rsyslogd is behaving better (it's still using about 3.5GB on each).
This is rsyslogd 7.4.4 and I understand that a memory leak was fixed in a newer version .
**My question:** before I rush to upgrade, I'd like to gather some evidence to show that I've indeed hit that leak, if possible. I've left the rsyslogd running for now but it won't be long until it churns all the swap so need to act reasonably soon...
One thing I have collecting evidence is 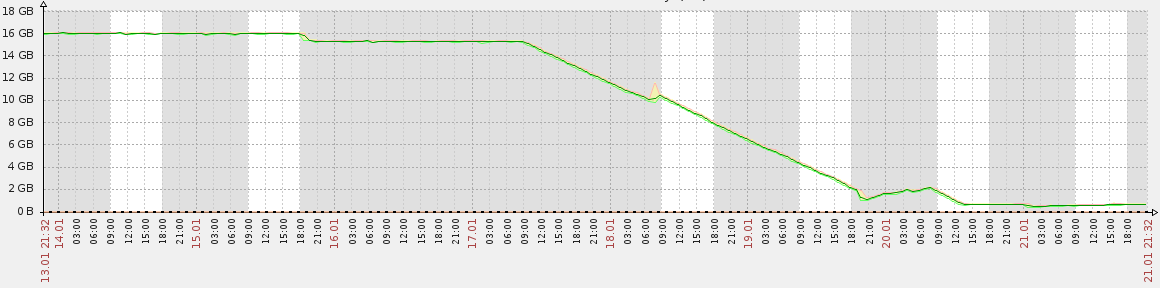 **final edit:** I had to restart that
atop. This clearly shows when the leak started occurring (and I don't recall doing anything special to the box at that time). What's interesting is that at the same time as memory starts to grow, disk write activity plummets - though it doesn't stop completely. The filesystem is fine capacity-wise.
$ atop -r atop_20160117 | grep rsyslogd
PID SYSCPU USRCPU VGROW RGROW RDDSK WRDSK ST EXC S CPU CMD
16212 0.03s 0.06s 0K 0K 0K 96K -- - S 0% rsyslogd
16212 0.11s 0.22s 0K 0K 0K 1844K -- - S 2% rsyslogd
16212 0.03s 0.12s 0K 0K 0K 564K -- - S 1% rsyslogd
16212 0.04s 0.06s 0K 0K 0K 96K -- - S 1% rsyslogd
16212 0.08s 0.19s 0K 0K 0K 1808K -- - S 1% rsyslogd
16212 0.04s 0.11s 0K 0K 0K 608K -- - S 1% rsyslogd
16212 0.02s 0.07s 0K 0K 0K 116K -- - S 0% rsyslogd
16212 0.06s 0.04s 0K 2640K 0K 144K -- - S 1% rsyslogd
16212 0.02s 0.02s 0K 1056K 0K 0K -- - S 0% rsyslogd
16212 0.01s 0.01s 0K 264K 0K 0K -- - S 0% rsyslogd
16212 0.02s 0.04s 0K 2904K 0K 0K -- - S 0% rsyslogd
16212 0.02s 0.02s 0K 1056K 0K 0K -- - S 0% rsyslogd
16212 0.02s 0.00s 0K 264K 0K 0K -- - S 0% rsyslogd
16212 0.06s 0.09s 75868K 3532K 208K 0K -- - S 1% rsyslogd
16212 0.02s 0.02s 0K 792K 0K 0K -- - S 0% rsyslogd
16212 0.01s 0.01s 0K 264K 0K 0K -- - S 0% rsyslogd
16212 0.05s 0.03s 0K 3168K 0K 0K -- - S 0% rsyslogd
16212 0.02s 0.02s 0K 1056K 0K 0K -- - S 0% rsyslogd
16212 0.00s 0.01s 0K 264K 0K 0K -- - S 0% rsyslogd
16212 0.03s 0.10s 0K 2904K 0K 0K -- - S 1% rsyslogd
16212 0.02s 0.02s 0K 792K 0K 0K -- - S 0% rsyslogd
16212 0.00s 0.02s 0K 264K 0K 0K -- - S 0% rsyslogd
16212 0.04s 0.03s 0K 2904K 0K 160K -- - S 0% rsyslogd
16212 0.02s 0.02s 0K 792K 0K 0K -- - S 0% rsyslogd
**edit:** here's the free memory graph from Zabbix for that box; the start of the decline at about 9:30 on 17-Jan coincides with atop's output above.
**final edit:** I had to restart that rsyslogd; it freed up a whooping 20 GB, confirming - if there was any doubt - that it was the culprit:
free -m
total used free shared buffers cached
Mem: 32142 11325 20817 282 56 473
-/+ buffers/cache: 10795 21347
Swap: 16383 5638 10745
Alas, after running only 12 hours, it's now back to over 4GB. Clearly something's not right; I'll have to try the upgrade path...
Asked by sxc731
(461 rep)
Jan 21, 2016, 04:16 PM
Last activity: Apr 21, 2021, 11:03 AM
Last activity: Apr 21, 2021, 11:03 AM