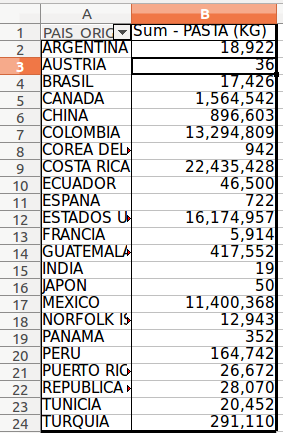
I have a pivot table summarizing numeric values per country (say, kilos of pasta consumed per year), sorted in descending order by amount consumed. For reasons, 4 countries represent over 90% of the total consumed, so that the remaining 10% is distributed across the rest in negligible amounts.
In Excel, I was able to Group those other countries into their own category ("Others"), aggregating their consumption, yielding cleaner tables and graphs (my table/graph now had 6 data rows, instead of 20-- one for each of the 4 big countries, the "Others," and the Total), making the whole thing easier to read.
When I try to do the same in LibreOffice, countries get grouped in alphabetical order (rather than by volume), creating a useless mess: I have the Others category, but it doesn't contain the right countries.
In theory, I could do it manually, by adding a column Country2, and using VLOOKUP to flag as Others the smaller countries. But that seems overkill: there should be a way to do it automatically.
Here's what I do and the results I get at each step:
1. Create the Pivot Table, adding first the Pasta field, and then the Country field
 2. Select the country rows, go to Data, Sort... and sort by Column B, Descending.
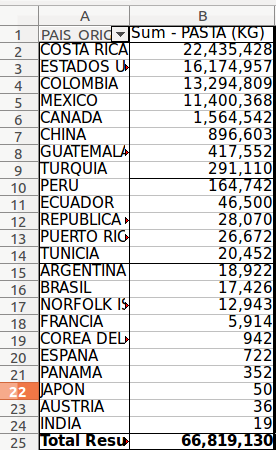 3. Drag-select from Guatemala downwards (so, Rows 8 - 24), click on Data, Group and Outline, Group. (Or press F12, if not bound to Guake, like me).
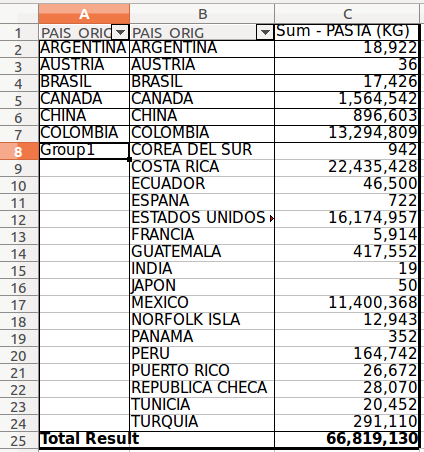 You'll notice that the countries are back in alphabetical order, though Group 1 was created with Rows 8 - 24, just not how I had them sorted.
2. Select the country rows, go to Data, Sort... and sort by Column B, Descending.
3. Drag-select from Guatemala downwards (so, Rows 8 - 24), click on Data, Group and Outline, Group. (Or press F12, if not bound to Guake, like me).
You'll notice that the countries are back in alphabetical order, though Group 1 was created with Rows 8 - 24, just not how I had them sorted.
Asked by Khashir
(93 rep)
Jan 25, 2017, 12:19 AM
Last activity: Feb 18, 2021, 03:49 PM
Last activity: Feb 18, 2021, 03:49 PM