Conky 1.11.6 - Want to eliminate gaps above/below graphs
1
vote
1
answer
372
views
## Environment
* Debian Linux 11.5 "bullseye"
* Conky 1.11.6 (compiled 2020-08-17, package 1.11.6-2)
* Xorg 1.20.11 (package 2:1.20.11-1+deb11u2)
* FVWM version 3 release 1.0.5 (built from git 23854ad7)
## Problem
I am trying to reduce the Conky window to show just a single graph (chart, plot) with absolutely no other elements. However, it seems Conky keeps adding a gap/border/margin/padding/spacing, above and below the plot area. The gaps appear as horizontal bars in the background color. I've tried every Conky option I can find, but the gap won't go away.
## Investigation
I've got gaps, margins, and border width set to zero. I've disabled all borders, ranges, scales, outlines, and shades. I've got the window and graph both set to 64 by 64. If I reduce the graph height, the entire window gets shorter, but the gaps remain in proportion. Likewise for increasing the graph height. If I resize the Conky window smaller with window manager controls, it clips off the graph. I can crop the bottom border this way, but not the top.
## Screenshot
In the combined screenshots below, the magenta arrows point to the gaps. The bright green is the plot area. The dark gray surrounds are window manager decorations, and serve to show where the black Conky window background ends. These are both 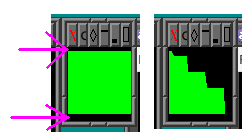 ## Config
The Conky config that produced the above is:
conky.config = {
own_window = true,
own_window_type = 'normal',
own_window_transparent = false,
own_window_hints = '',
alignment = 'top_middle',
own_window_title = 'conky_gaptest',
double_buffer = true,
disable_auto_reload = true,
top_cpu_separate = false,
update_interval = 0.5,
show_graph_range = false,
show_graph_scale = false,
draw_outline = false,
draw_shades = false,
draw_borders = false,
draw_graph_borders = false,
gap_x = 0,
gap_y = 0,
border_inner_margin = 0,
border_outer_margin = 0,
border_width = 0,
extra_newline = false,
default_color = 'white',
maximum_width = 64,
default_graph_width = 64,
default_graph_height = 64,
}
conky.text = [[${cpugraph cpu0 64,64 00ff00 00ff00}]]
Anyone have any suggestions?
## Background
(I am doing this because I want to make the Conky window suitable for swallowing into FvwmButtons. I have a vaguely NeXTstep-esque dock/wharf/panel/sidebar, made of 64x64 pixel buttons. I'd like some of the buttons to be Conky graphs. But as long as those gaps are there, it wastes part of the tiny 64x64 space.
## Config
The Conky config that produced the above is:
conky.config = {
own_window = true,
own_window_type = 'normal',
own_window_transparent = false,
own_window_hints = '',
alignment = 'top_middle',
own_window_title = 'conky_gaptest',
double_buffer = true,
disable_auto_reload = true,
top_cpu_separate = false,
update_interval = 0.5,
show_graph_range = false,
show_graph_scale = false,
draw_outline = false,
draw_shades = false,
draw_borders = false,
draw_graph_borders = false,
gap_x = 0,
gap_y = 0,
border_inner_margin = 0,
border_outer_margin = 0,
border_width = 0,
extra_newline = false,
default_color = 'white',
maximum_width = 64,
default_graph_width = 64,
default_graph_height = 64,
}
conky.text = [[${cpugraph cpu0 64,64 00ff00 00ff00}]]
Anyone have any suggestions?
## Background
(I am doing this because I want to make the Conky window suitable for swallowing into FvwmButtons. I have a vaguely NeXTstep-esque dock/wharf/panel/sidebar, made of 64x64 pixel buttons. I'd like some of the buttons to be Conky graphs. But as long as those gaps are there, it wastes part of the tiny 64x64 space.
${cpugraph} charts, with the CPU made artificially busy for test purposes.
## Config
The Conky config that produced the above is:
conky.config = {
own_window = true,
own_window_type = 'normal',
own_window_transparent = false,
own_window_hints = '',
alignment = 'top_middle',
own_window_title = 'conky_gaptest',
double_buffer = true,
disable_auto_reload = true,
top_cpu_separate = false,
update_interval = 0.5,
show_graph_range = false,
show_graph_scale = false,
draw_outline = false,
draw_shades = false,
draw_borders = false,
draw_graph_borders = false,
gap_x = 0,
gap_y = 0,
border_inner_margin = 0,
border_outer_margin = 0,
border_width = 0,
extra_newline = false,
default_color = 'white',
maximum_width = 64,
default_graph_width = 64,
default_graph_height = 64,
}
conky.text = [[${cpugraph cpu0 64,64 00ff00 00ff00}]]
Anyone have any suggestions?
## Background
(I am doing this because I want to make the Conky window suitable for swallowing into FvwmButtons. I have a vaguely NeXTstep-esque dock/wharf/panel/sidebar, made of 64x64 pixel buttons. I'd like some of the buttons to be Conky graphs. But as long as those gaps are there, it wastes part of the tiny 64x64 space. wmload doesn't have this problem, but sucks in other ways.)
Asked by Ben Scott
(209 rep)
Nov 13, 2022, 06:56 PM
Last activity: Nov 14, 2022, 03:01 AM
Last activity: Nov 14, 2022, 03:01 AM