Is there a reason why sar would show different monitoring statistics on memory than other monitoring tools like dynatrace?
1
vote
1
answer
185
views
I'm currently investigating why I didn't get notified about a high memory utilization on one RHEL server from dynatrace. When checking the graphs of memory usage, both *sar* and *dynatrace* show different results.
On SAR it is showing that the server is using 90% for about 11 hours, here's the screenshot of that: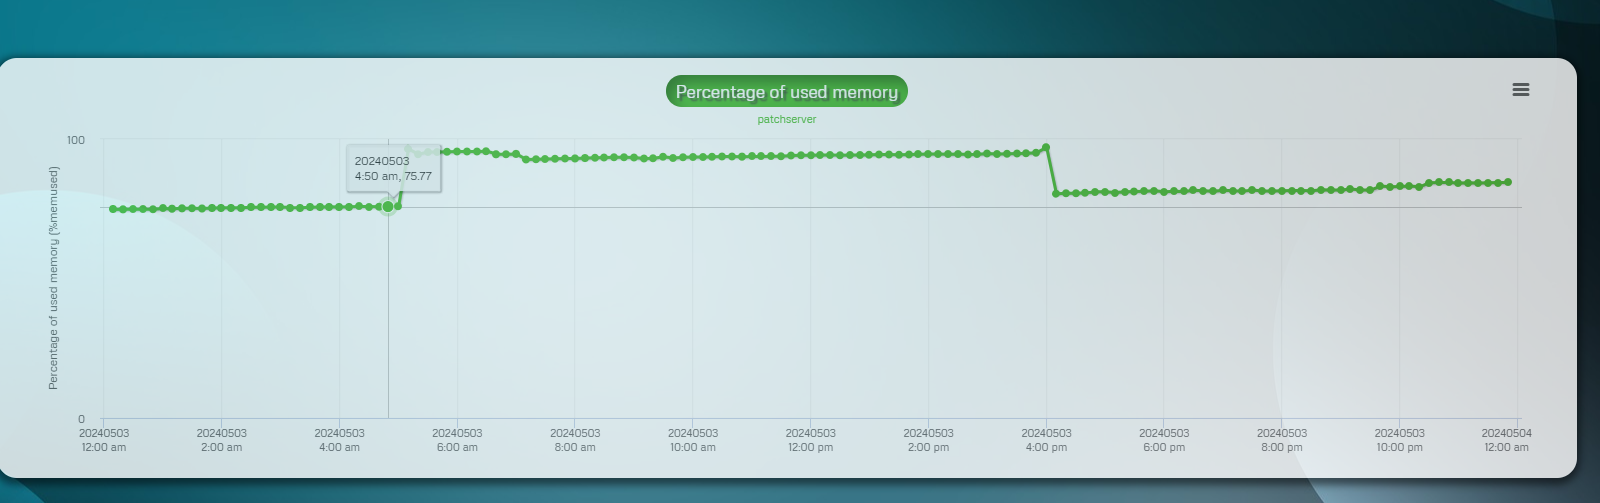 And on the same day this is what dynatrace shows:
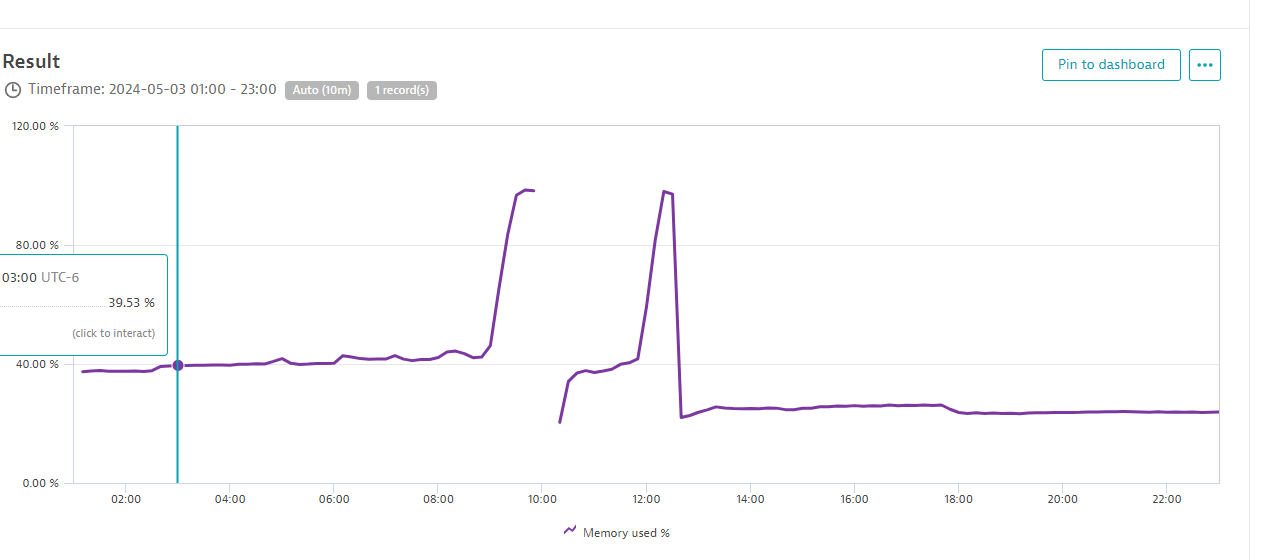 And as you can see they are both from May 3 2024. The metric they are using is memory usage %. I'm very confused about these two graphs, I'm not an expert on sar so maybe I'm missing something else, if somebody could help me to find out if I'm missing something that will be very appreciated!
On SAR it is showing that the server is using 90% for about 11 hours, here's the screenshot of that:
And on the same day this is what dynatrace shows:
And as you can see they are both from May 3 2024. The metric they are using is memory usage %. I'm very confused about these two graphs, I'm not an expert on sar so maybe I'm missing something else, if somebody could help me to find out if I'm missing something that will be very appreciated!
Asked by VaTo
(3248 rep)
May 6, 2024, 06:55 PM
Last activity: May 7, 2024, 06:50 PM
Last activity: May 7, 2024, 06:50 PM