I have a desktop computer (Intel i4770) running Oracle Linux 7.9 with kernel 4.1.12-61. I usually keep it off and only turn it on on the rare occasions when I need to test something. A month or so ago, I turned it on and noticed that the fans were on max speed - I checked top and found that setroubleshoot was at 100% so I killed the process. The process kept coming back and I kept killing it but ultimately, it didn't matter much because my testing was done and I turned the computer off again. (Yes, I always shut it down the right way.)
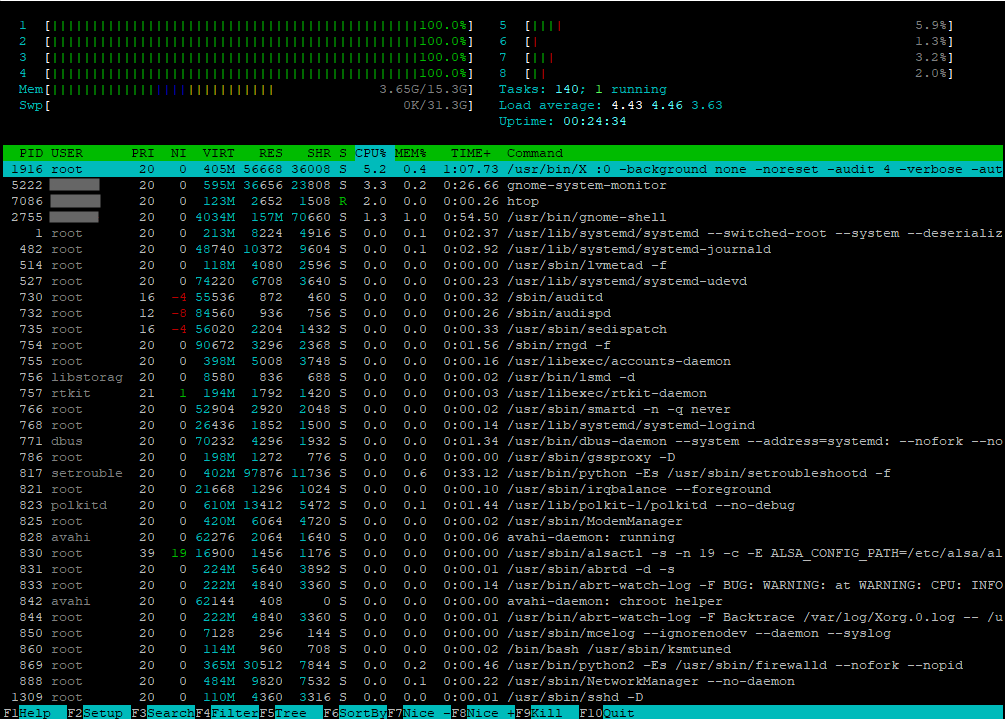
Now trying to get to the root of the problem, setroubleshoot is no longer showing 100% in top. In fact, nothing is even close to 100%. Running htop, I can get details about the CPUs and 4 of the 8 cores are permanently 100%. From the time the computer lets me log in to when I shut it down. But there's nothing in the list of processes even above 5.2%.
 When I run perf on each core with
 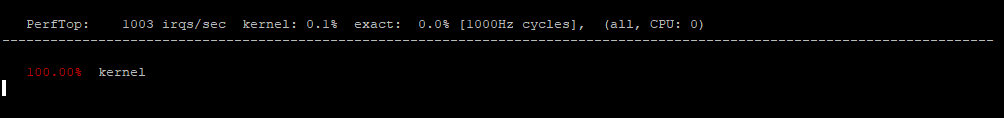 Here is the perf report from running
 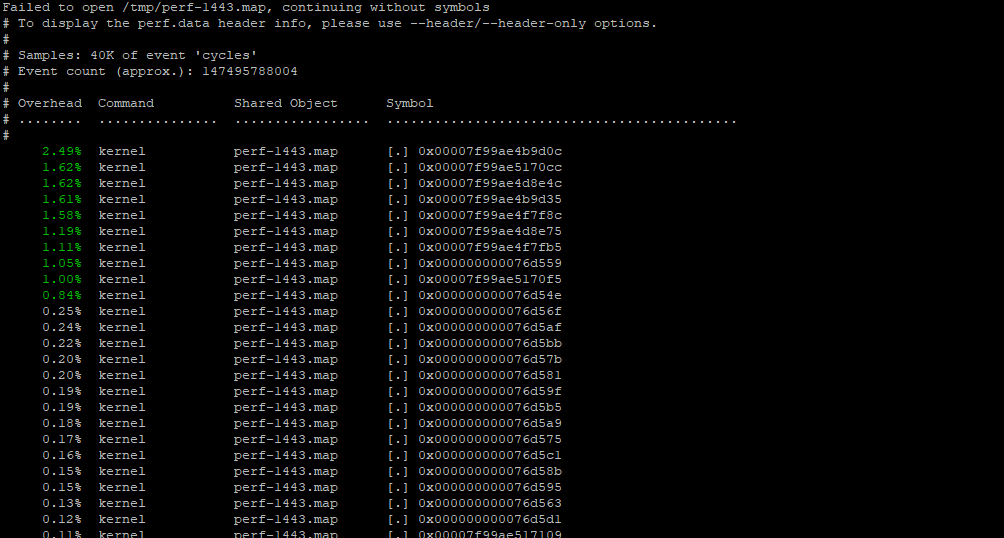 On the desktop of this computer, I noticed a bunch of SELinux errors. They all appear to be saying that there was an attempt to execute something that should not have been allowed.
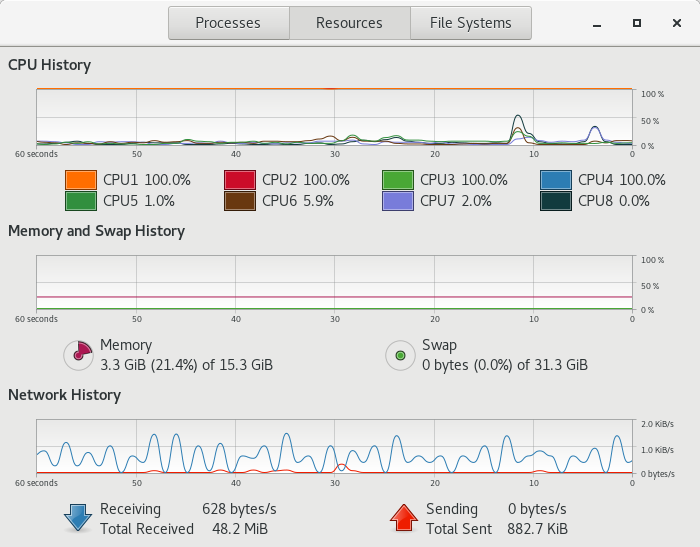
 And just to confirm that htop was right about what it was reporting, here's the report from the System Monitor.
 Booting into a prior version of the kernel didn't help. And booting into the "rescue" kernel didn't help either.
I tried updating the kernel but that didn't help. I ran a software update and that didn't help either. Note that I hadn't done any updates or installed any new software immediately prior to this problem starting. This install had been stable for years when I needed it.
I also tried installing the same OS over again on a new external drive. That worked. No issues on that drive. But when I boot to that drive and then choose the kernel that is on the main drive, the problem returns. That all seems to prove that the kernel isn't the issue but the system main drive has something wrong.
I'm at a loss for how to debug further. I can't figure out what changed and why so I don't know how to even start fixing it. Any help about where to look and what to check would be appreciated!
___ Edit 1: ___
Output from
Booting into a prior version of the kernel didn't help. And booting into the "rescue" kernel didn't help either.
I tried updating the kernel but that didn't help. I ran a software update and that didn't help either. Note that I hadn't done any updates or installed any new software immediately prior to this problem starting. This install had been stable for years when I needed it.
I also tried installing the same OS over again on a new external drive. That worked. No issues on that drive. But when I boot to that drive and then choose the kernel that is on the main drive, the problem returns. That all seems to prove that the kernel isn't the issue but the system main drive has something wrong.
I'm at a loss for how to debug further. I can't figure out what changed and why so I don't know how to even start fixing it. Any help about where to look and what to check would be appreciated!
___ Edit 1: ___
Output from 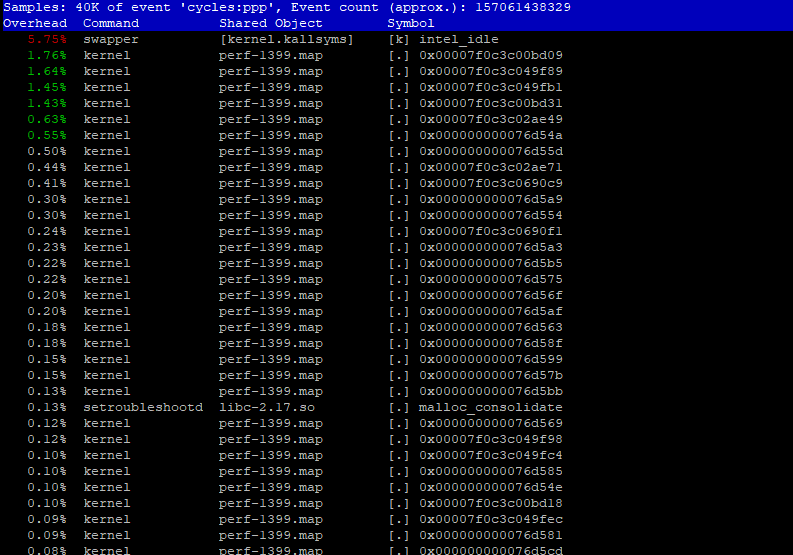 The number in the list above, 1399, is the PID for the process but that process isn't visible either through
When I run perf on each core with perf top -C 1 --sort comm, I can see that cores zero through 3 are all 100% kernel.
Here is the perf report from running perf record -a -F 999 -- sleep 10. I don't know if the failure to find useful symbols is indicative of the problem I'm chasing, if it is a different issue that I'll need help figure out, or if it is something that should be ignored.
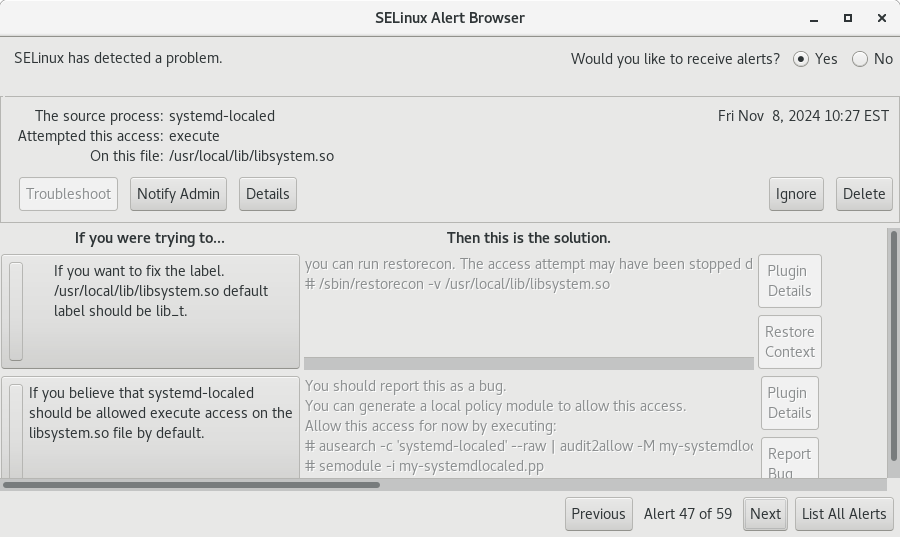
On the desktop of this computer, I noticed a bunch of SELinux errors. They all appear to be saying that there was an attempt to execute something that should not have been allowed.
And just to confirm that htop was right about what it was reporting, here's the report from the System Monitor.
Booting into a prior version of the kernel didn't help. And booting into the "rescue" kernel didn't help either.
I tried updating the kernel but that didn't help. I ran a software update and that didn't help either. Note that I hadn't done any updates or installed any new software immediately prior to this problem starting. This install had been stable for years when I needed it.
I also tried installing the same OS over again on a new external drive. That worked. No issues on that drive. But when I boot to that drive and then choose the kernel that is on the main drive, the problem returns. That all seems to prove that the kernel isn't the issue but the system main drive has something wrong.
I'm at a loss for how to debug further. I can't figure out what changed and why so I don't know how to even start fixing it. Any help about where to look and what to check would be appreciated!
___ Edit 1: ___
Output from ps -efl|sort -rk14|head:
F S UID PID PPID C PRI NI ADDR SZ WCHAN STIME TTY TIME CMD
0 S gdm 2085 2041 2 80 0 - 905731 - 17:42 ? 00:00:02 /usr/bin/gnome-shell
4 S root 1 0 1 80 0 - 54811 - 17:41 ? 00:00:01 /usr/lib/systemd/systemd --switched-root --system --deserialize 22
4 S root 837 1 1 80 0 - 22671 - 17:42 ? 00:00:01 /sbin/rngd -f
1 S root 405 2 0 60 -20 - 0 - 17:41 ? 00:00:00 [xfs_mru_cache]
1 S root 407 2 0 60 -20 - 0 - 17:41 ? 00:00:00 [xfs-data/sda1]
1 S root 408 2 0 60 -20 - 0 - 17:41 ? 00:00:00 [xfs-conv/sda1]
1 S root 409 2 0 60 -20 - 0 - 17:41 ? 00:00:00 [xfs-cil/sda1]
1 S root 406 2 0 60 -20 - 0 - 17:41 ? 00:00:00 [xfs-buf/sda1]
1 S root 404 2 0 60 -20 - 0 - 17:41 ? 00:00:00 [xfsalloc]
output from dmesg | grep libsystem
[ 3.344918] audit: type=1400 audit(1731105719.768:4): avc: denied { execute } for pid=496 comm="systemd-journal" path="/usr/local/lib/libsystem.so" dev="sda1" ino=136977390 scontext=system_u:system_r:syslogd_t:s0 tcontext=unconfined_u:object_r:user_tmp_t:s0 tclass=file permissive=0
[ 3.351928] audit: type=1400 audit(1731105719.775:6): avc: denied { execute } for pid=502 comm="systemd-readahe" path="/usr/local/lib/libsystem.so" dev="sda1" ino=136977390 scontext=system_u:system_r:readahead_t:s0 tcontext=unconfined_u:object_r:user_tmp_t:s0 tclass=file permissive=0
[ 3.351929] audit: type=1400 audit(1731105719.775:5): avc: denied { execute } for pid=503 comm="systemd-readahe" path="/usr/local/lib/libsystem.so" dev="sda1" ino=136977390 scontext=system_u:system_r:readahead_t:s0 tcontext=unconfined_u:object_r:user_tmp_t:s0 tclass=file permissive=0
[ 3.374010] audit: type=1400 audit(1731105719.797:7): avc: denied { execute } for pid=513 comm="systemd-tmpfile" path="/usr/local/lib/libsystem.so" dev="sda1" ino=136977390 scontext=system_u:system_r:systemd_tmpfiles_t:s0 tcontext=unconfined_u:object_r:user_tmp_t:s0 tclass=file permissive=0
[ 3.386383] audit: type=1400 audit(1731105719.810:8): avc: denied { execute } for pid=525 comm="systemd-sysctl" path="/usr/local/lib/libsystem.so" dev="sda1" ino=136977390 scontext=system_u:system_r:systemd_sysctl_t:s0 tcontext=unconfined_u:object_r:user_tmp_t:s0 tclass=file permissive=0
[ 3.397457] audit: type=1400 audit(1731105719.821:9): avc: denied { execute } for pid=536 comm="hostname" path="/usr/local/lib/libsystem.so" dev="sda1" ino=136977390 scontext=system_u:system_r:hostname_t:s0 tcontext=unconfined_u:object_r:user_tmp_t:s0 tclass=file permissive=0
[ 3.673352] audit: type=1400 audit(1731105720.097:10): avc: denied { execute } for pid=657 comm="alsactl" path="/usr/local/lib/libsystem.so" dev="sda1" ino=136977390 scontext=system_u:system_r:alsa_t:s0-s0:c0.c1023 tcontext=unconfined_u:object_r:user_tmp_t:s0 tclass=file permissive=0
___ Edit 2: ___
I installed kernel debug info and downgraded perf to version 3 since apparently there is a bug with the perf version for OL7.9 . However there are still symbols that can't be found.
The number in the list above, 1399, is the PID for the process but that process isn't visible either through htop or ps. As soon as I did a kill -9 1399, the CPU usage immediately dropped to zero. That's nice because at least the problem process is now dead. And I know how to kill it, even though I don't see it in the normal process lists.
But the fundamental question remains - where is this process coming from and how do I stop it from starting in the first place!?
Asked by ktbos
(111 rep)
Nov 8, 2024, 07:24 PM
Last activity: Nov 11, 2024, 05:30 PM
Last activity: Nov 11, 2024, 05:30 PM