What is the meaning of columns in the table displayed by cpupower-monitor?
0
votes
0
answers
33
views
Running 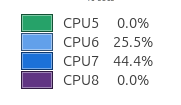 Additionally, why logical CPUs of the same physical core show different frequencies?
sudo cpupower monitor on Ubuntu 24.04 I'm getting:
| Nehalem                   || Mperf              || RAPL               || Idle_Stats
 CPU| C3   | C6   | PC3  | PC6   || C0   | Cx   | Freq  || pack | core | unco  || POLL | C1_A | C2_A | C3_A
   0|  0.00|  0.46|  0.00|  0.00|| 11.71| 88.29|  3060||37496059|27532217| 73852||  0.01|  8.94| 79.93|  0.00
   1|  0.00|  0.46|  0.00|  0.00||  6.56| 93.44|  2790||37496059|27532217| 73852||  0.00|  2.56| 53.19| 37.97
   2|  0.00|  4.67|  0.00|  0.00||  9.14| 90.86|  3194||37496059|27532217| 73852||  0.01|  4.43| 58.09| 28.77
   3|  0.00|  4.67|  0.00|  0.00||  6.24| 93.76|  3239||37496059|27532217| 73852||  0.00|  1.69| 34.62| 57.66
   4|  0.00|  0.00|  0.00|  0.00||  0.29| 99.71|  4461||37496059|27532217| 73852||  0.00|  0.00|  0.00| 99.97
   5|  0.00|  0.00|  0.00|  0.00|| 29.52| 70.48|  4457||37496059|27532217| 73852||  0.00| 64.48|  0.00|  6.48
   6|  0.00|  0.00|  0.00|  0.00|| 47.92| 52.08|  4123||37496059|27532217| 73852||  0.00|  0.95|  0.31| 51.40
   7|  0.00|  0.00|  0.00|  0.00||  0.00|100.00|  3753||37496059|27532217| 73852||  0.00|  0.00|  0.00| 99.99
   8|  0.00| 25.03|  0.00|  0.00||  3.27| 96.73|  2807||37496059|27532217| 73852||  0.01|  4.13| 54.72| 38.03
   9|  0.00| 62.12|  0.00|  0.00||  2.32| 97.68|  2897||37496059|27532217| 73852||  0.00|  1.29| 30.79| 65.69
  10|  0.00| 77.85|  0.00|  0.00||  2.19| 97.81|  3064||37496059|27532217| 73852||  0.00|  0.94| 18.42| 78.51
  11|  0.00|  0.00|  0.00|  0.00|| 14.84| 85.16|  2497||37496059|27532217| 73852||  0.01| 57.88| 27.45|  0.38
  12|  0.00| 70.55|  0.00|  0.00||  3.27| 96.73|  2399||37496059|27532217| 73852||  0.00|  1.33| 30.14| 65.41
  13|  0.00| 54.45|  0.00|  0.00||  4.02| 95.98|  2213||37496059|27532217| 73852||  0.00|  1.06| 43.49| 51.62
  14|  0.00| 67.90|  0.00|  0.00||  3.36| 96.64|  2334||37496059|27532217| 73852||  0.00|  1.34| 30.91| 64.54
15| 0.00| 72.39| 0.00| 0.00|| 2.41| 97.59| 2167||37496059|27532217| 73852|| 0.00| 1.25| 26.74| 69.73cpupower manual (https://linux.die.net/man/1/cpupower-monitor) doesn't have that information. I'm assuming that C3, C6, etc. are percentages of time spent in a given CPU C-state.
Also, I'm running a program with two threads pinned to CPU #5 and #6. Cores #2 and #3 containing hyperthreaded CPUs 4-7 are isolated with GRUB_CMDLINE_LINUX="nohz=on nohz_full=4-7 rcu_nocbs=4-7 isolcpus=4-7 irqaffinity=0-3,8-15". The table above confirms load on CPU #5 and #6, but also consistently shows some marginal load on CPU #4. It doesn't correspond to the screen of Ubuntu System Monitor, which consistently shows 0% load on CPU #4 listed as CPU5 here:
Additionally, why logical CPUs of the same physical core show different frequencies?
Asked by Paul Jurczak
(151 rep)
Nov 23, 2024, 03:38 AM
Last activity: Nov 23, 2024, 06:46 AM
Last activity: Nov 23, 2024, 06:46 AM