cgroup / cpu scheduler tuning questions, cpu pressure & uclamp behavior
2
votes
0
answers
25
views
I've been working on this for a few days and I'm scratching my head. The kernel docs for cgroups, pressure stall information, and the scheduler have not helped me shed any light on this so far, so I am hoping you can help.
I have 3 related processes which run in their own cgroup. It is a root partition and the only partition which may use cpus 3-10. One application runs on CPU 11 and all other processes run on cpus 0-2.
$ cat cpuset.cpus.effective
3-10SCHED_OTHER scheduler class right now.
$ for PROC in $(cat cgroup.procs); do chrt -p $PROC; done
pid 16049's current scheduling policy: SCHED_OTHER
pid 16049's current scheduling priority: 0
pid 16058's current scheduling policy: SCHED_OTHER
pid 16058's current scheduling priority: 0
pid 16059's current scheduling policy: SCHED_OTHER
pid 16059's current scheduling priority: 0$ cat cpu.stat
usage_usec 1724410414
user_usec 737614077
system_usec 986796337
nr_periods 0
nr_throttled 0
throttled_usec 0cpu.pressure is full ~1% of the time
$ cat cpu.pressure
some avg10=6.85 avg60=5.87 avg300=3.98 total=45578161
full avg10=1.00 avg60=0.73 avg300=0.27 total=9479354cpu.uclamp.min to max
* full drops to 0%
* some drops to ~3%
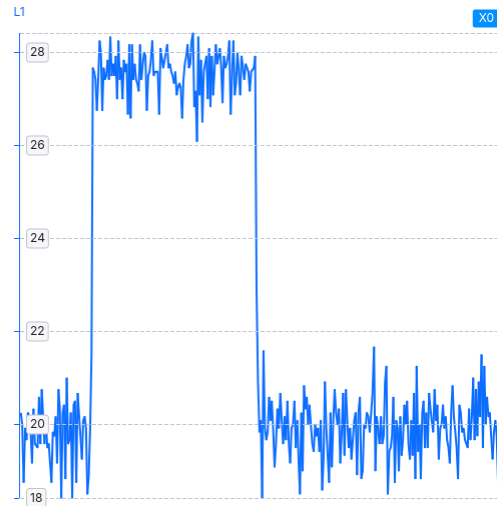
* the main application in the group's CPU usage drops from ~156% to ~100%
* average CPU utilization drops (see graph below, where it drops is when I set cpu.uclamp.min to max)
$ cat cpu.pressure
some avg10=6.85 avg60=5.87 avg300=3.98 total=45578161
full avg10=1.00 avg60=0.73 avg300=0.27 total=9479354

$ echo max > cpu.uclamp.min

# wait a lil bit

$ cat cpu.pressure
some avg10=3.00 avg60=3.18 avg300=4.09 total=61530804
full avg10=0.00 avg60=0.06 avg300=0.32 total=12734850# with cpu.uclamp.min = 0
CPU [22%@1971,16%@1971,17%@1971,4%@1971,39%@729,38%@729,40%@729,36%@729,36%@729,37%@729,37%@729,10%@729]
# with cpu.uclamp.min = max
CPU [26%@729,14%@1971,21%@729,2%@1971,29%@806,26%@1971,26%@1971,27%@1971,20%@729,25%@729,25%@729,7%@727]cpu.uclamp.min setting. The system has 47 GiB of free memory, ~5 GiB in use, and ~1.5 Gib as caches.
1. How can I have CPU pressure when none of my CPUs are full, and there's no memory or io pressure?
2. Why does changing the uclamp.min value result in lower CPU usage when the system has excess CPU, memory, and IO resources available?
* especially since no other process is allowed to use those cores either way
3. Are there other scheduler classes or settings I can use to tune the performance so that my processes aren't waiting for CPU while my cores sit idle?
4. Any other ways I can debug what the bottleneck is?
Edit:
Additional details - I'm running 5.15.148 kernel on aarch64 using a (customized) poky based yocto image.
Asked by tbot
(21 rep)
Aug 1, 2025, 07:52 PM
Last activity: Aug 1, 2025, 07:56 PM
Last activity: Aug 1, 2025, 07:56 PM