I'm trying to plot the data of 100x11 array in plot using gnuplot. I created a .gnu file to generate plot but unable to get jitter plot.
I'm using the below code
set terminal pngcairo size 1280,800 enhanced font 'Helvetica,24'
set output "coin_flip.png"
# Title, axis label, range and ticks
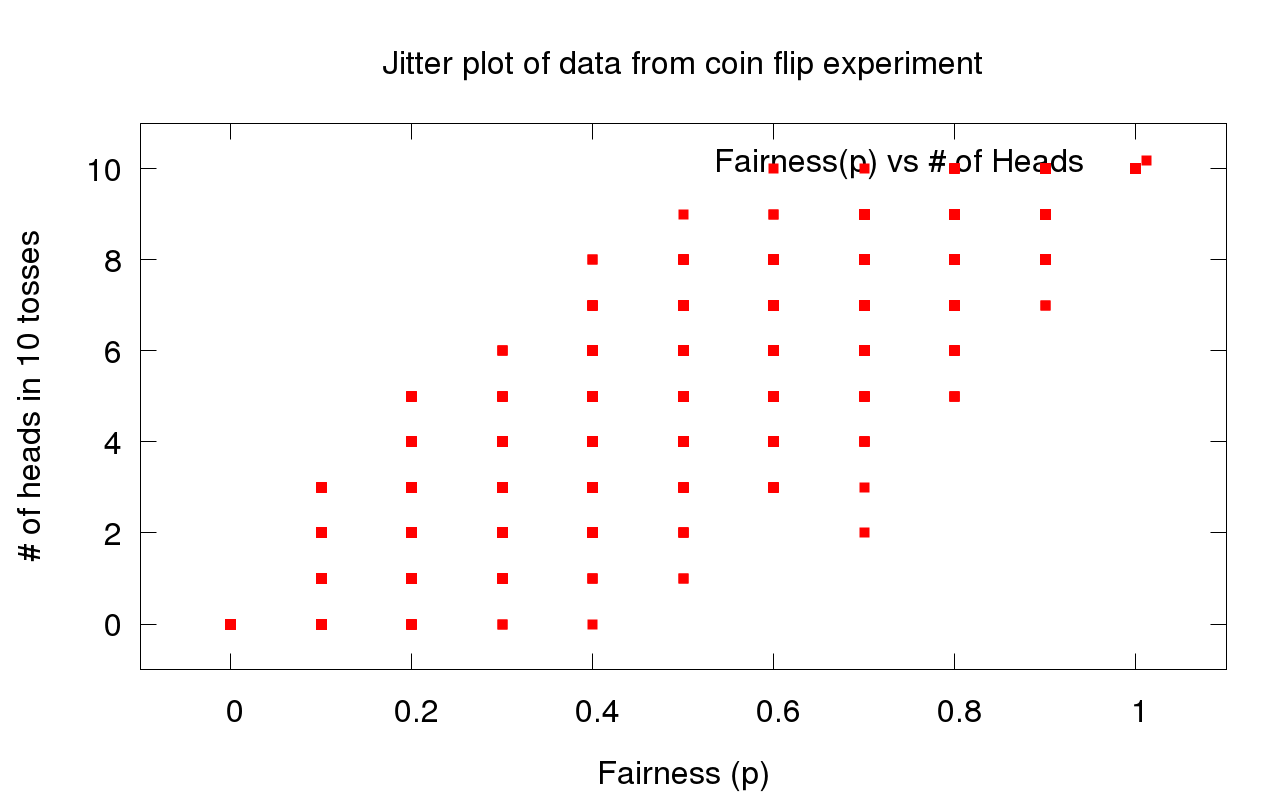
set title "Jitter plot of data from coin flip experiment"
set xlabel "Fairness (p)"
set ylabel "# of heads in 10 tosses"
set xrange [-0.1:1.1]
set yrange [-1:11]
# Line styles
set style line 1 lt -1 lw 4 pt 5 lc rgb "red"
set style line 2 lt -1 lw 4 pt 7 lc rgb "blue"
set style line 4 lt -1 lw 4 pt 7 lc rgb "green"
set style line 5 lt -1 lw 4 pt 13 lc rgb "purple"
set style line 6 lt -1 lw 8 pt 13 lc rgb "black"
# Function definitions and curve fits
set fit logfile 'coin_flip.log'
#Fit
plot "coin_flip.dat" using 1:2 ti "Fairness(p) vs # of Heads" ls 1
I'm getting below result
 But I'm trying to get as the below plot
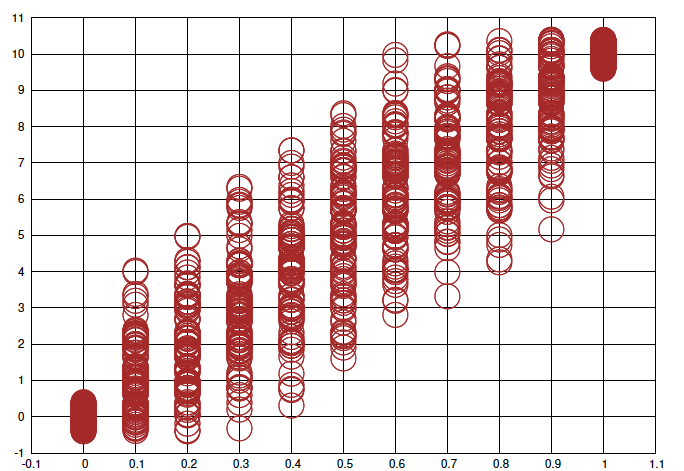 Can you please help me in plotting?
But I'm trying to get as the below plot
Can you please help me in plotting?
Asked by Venkat
(1 rep)
Mar 3, 2018, 04:37 PM
Last activity: Mar 4, 2018, 10:50 AM
Last activity: Mar 4, 2018, 10:50 AM