Hardware:
- Samsung 980 PRO M.2 NVMe SSD (MZ-V8P2T0BW) (2TB)
- Beelink GTR6, with the SSD in the NVMe slot
Since the hardware arrived, I've installed Ubuntu Server on it as well as a bunch of services (mostly in docker, DBs and services like Kafka).
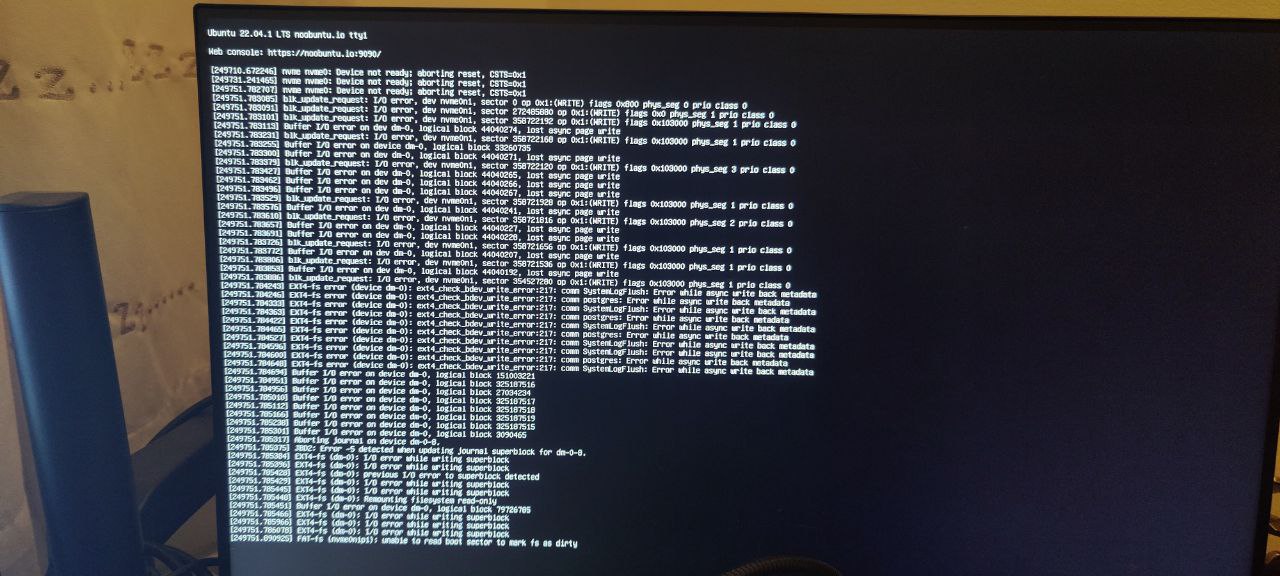
After 2-3 days of uptime (record is almost a week, but usually it's 2-3 days), I typically start getting buffer i/o errors on the nvme slot (which is also the boot drive):
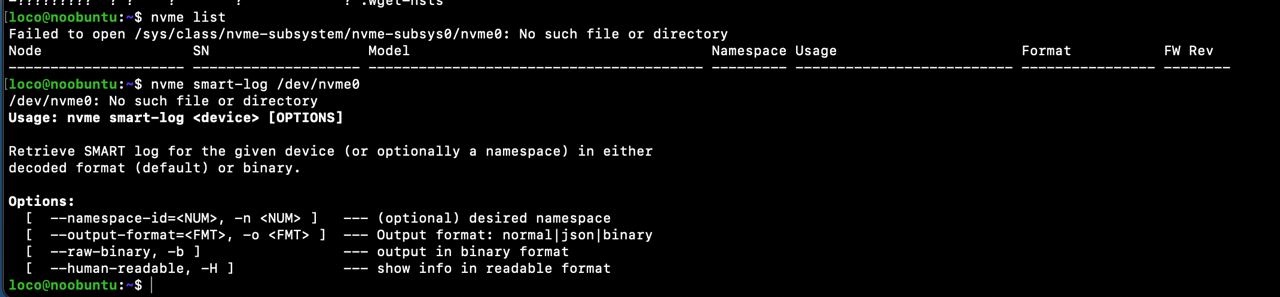
 If I'm quick enough, I can still login via SSH but the system becomes increasingly unstable before commands start failing with an I/O error. When I did manage to login, it did seem to think there's no connected NVME SSDs:
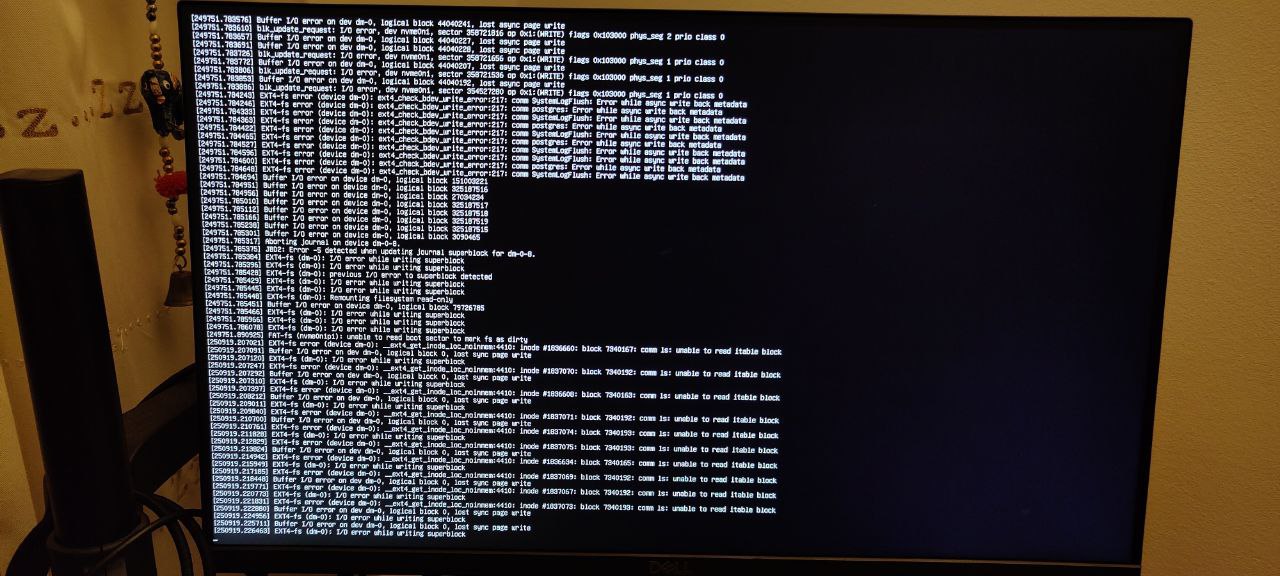
 Another instance of the buffer I/O error on the nvme slot:
 Because of this and trying to check everything I could find, I ran FSCK on boot to see if there was anything obvious - this is quite common after the hard reset:
# cat /run/initramfs/fsck.log
Log of fsck -C -f -y -V -t ext4 /dev/mapper/ubuntu--vg-ubuntu--lv
Fri Dec 30 17:26:21 2022
fsck from util-linux 2.37.2
[/usr/sbin/fsck.ext4 (1) -- /dev/mapper/ubuntu--vg-ubuntu--lv] fsck.ext4 -f -y -C0 /dev/mapper/ubuntu--vg-ubuntu--lv
e2fsck 1.46.5 (30-Dec-2021)
/dev/mapper/ubuntu--vg-ubuntu--lv: recovering journal
Clearing orphaned inode 524449 (uid=1000, gid=1000, mode=0100664, size=6216)
Pass 1: Checking inodes, blocks, and sizes
Inode 6947190 extent tree (at level 1) could be shorter. Optimize? yes
Inode 6947197 extent tree (at level 1) could be shorter. Optimize? yes
Inode 6947204 extent tree (at level 1) could be shorter. Optimize? yes
Inode 6947212 extent tree (at level 1) could be shorter. Optimize? yes
Inode 6947408 extent tree (at level 1) could be shorter. Optimize? yes
Inode 6947414 extent tree (at level 1) could be shorter. Optimize? yes
Inode 6947829 extent tree (at level 1) could be shorter. Optimize? yes
Inode 6947835 extent tree (at level 1) could be shorter. Optimize? yes
Inode 6947841 extent tree (at level 1) could be shorter. Optimize? yes
Pass 1E: Optimizing extent trees
Pass 2: Checking directory structure
Pass 3: Checking directory connectivity
Pass 4: Checking reference counts
Pass 5: Checking group summary information
Free blocks count wrong (401572584, counted=405399533).
Fix? yes
Free inodes count wrong (121360470, counted=121358242).
Fix? yes
/dev/mapper/ubuntu--vg-ubuntu--lv: ***** FILE SYSTEM WAS MODIFIED *****
/dev/mapper/ubuntu--vg-ubuntu--lv: 538718/121896960 files (0.2% non-contiguous), 82178067/487577600 blocks
fsck exited with status code 1
Fri Dec 30 17:26:25 2022
----------------
Running smart-log doesn't seem to show anything concerning, other than the number of unsafe shutdowns (the number of times this has happened so far)...
# nvme smart-log /dev/nvme0
Smart Log for NVME device:nvme0 namespace-id:ffffffff
critical_warning : 0
temperature : 32 C (305 Kelvin)
available_spare : 100%
available_spare_threshold : 10%
percentage_used : 0%
endurance group critical warning summary: 0
data_units_read : 8,544,896
data_units_written : 5,175,904
host_read_commands : 39,050,379
host_write_commands : 191,366,905
controller_busy_time : 1,069
power_cycles : 21
power_on_hours : 142
unsafe_shutdowns : 12
media_errors : 0
num_err_log_entries : 0
Warning Temperature Time : 0
Critical Composite Temperature Time : 0
Temperature Sensor 1 : 32 C (305 Kelvin)
Temperature Sensor 2 : 36 C (309 Kelvin)
Thermal Management T1 Trans Count : 0
Thermal Management T2 Trans Count : 0
Thermal Management T1 Total Time : 0
Thermal Management T2 Total Time : 0
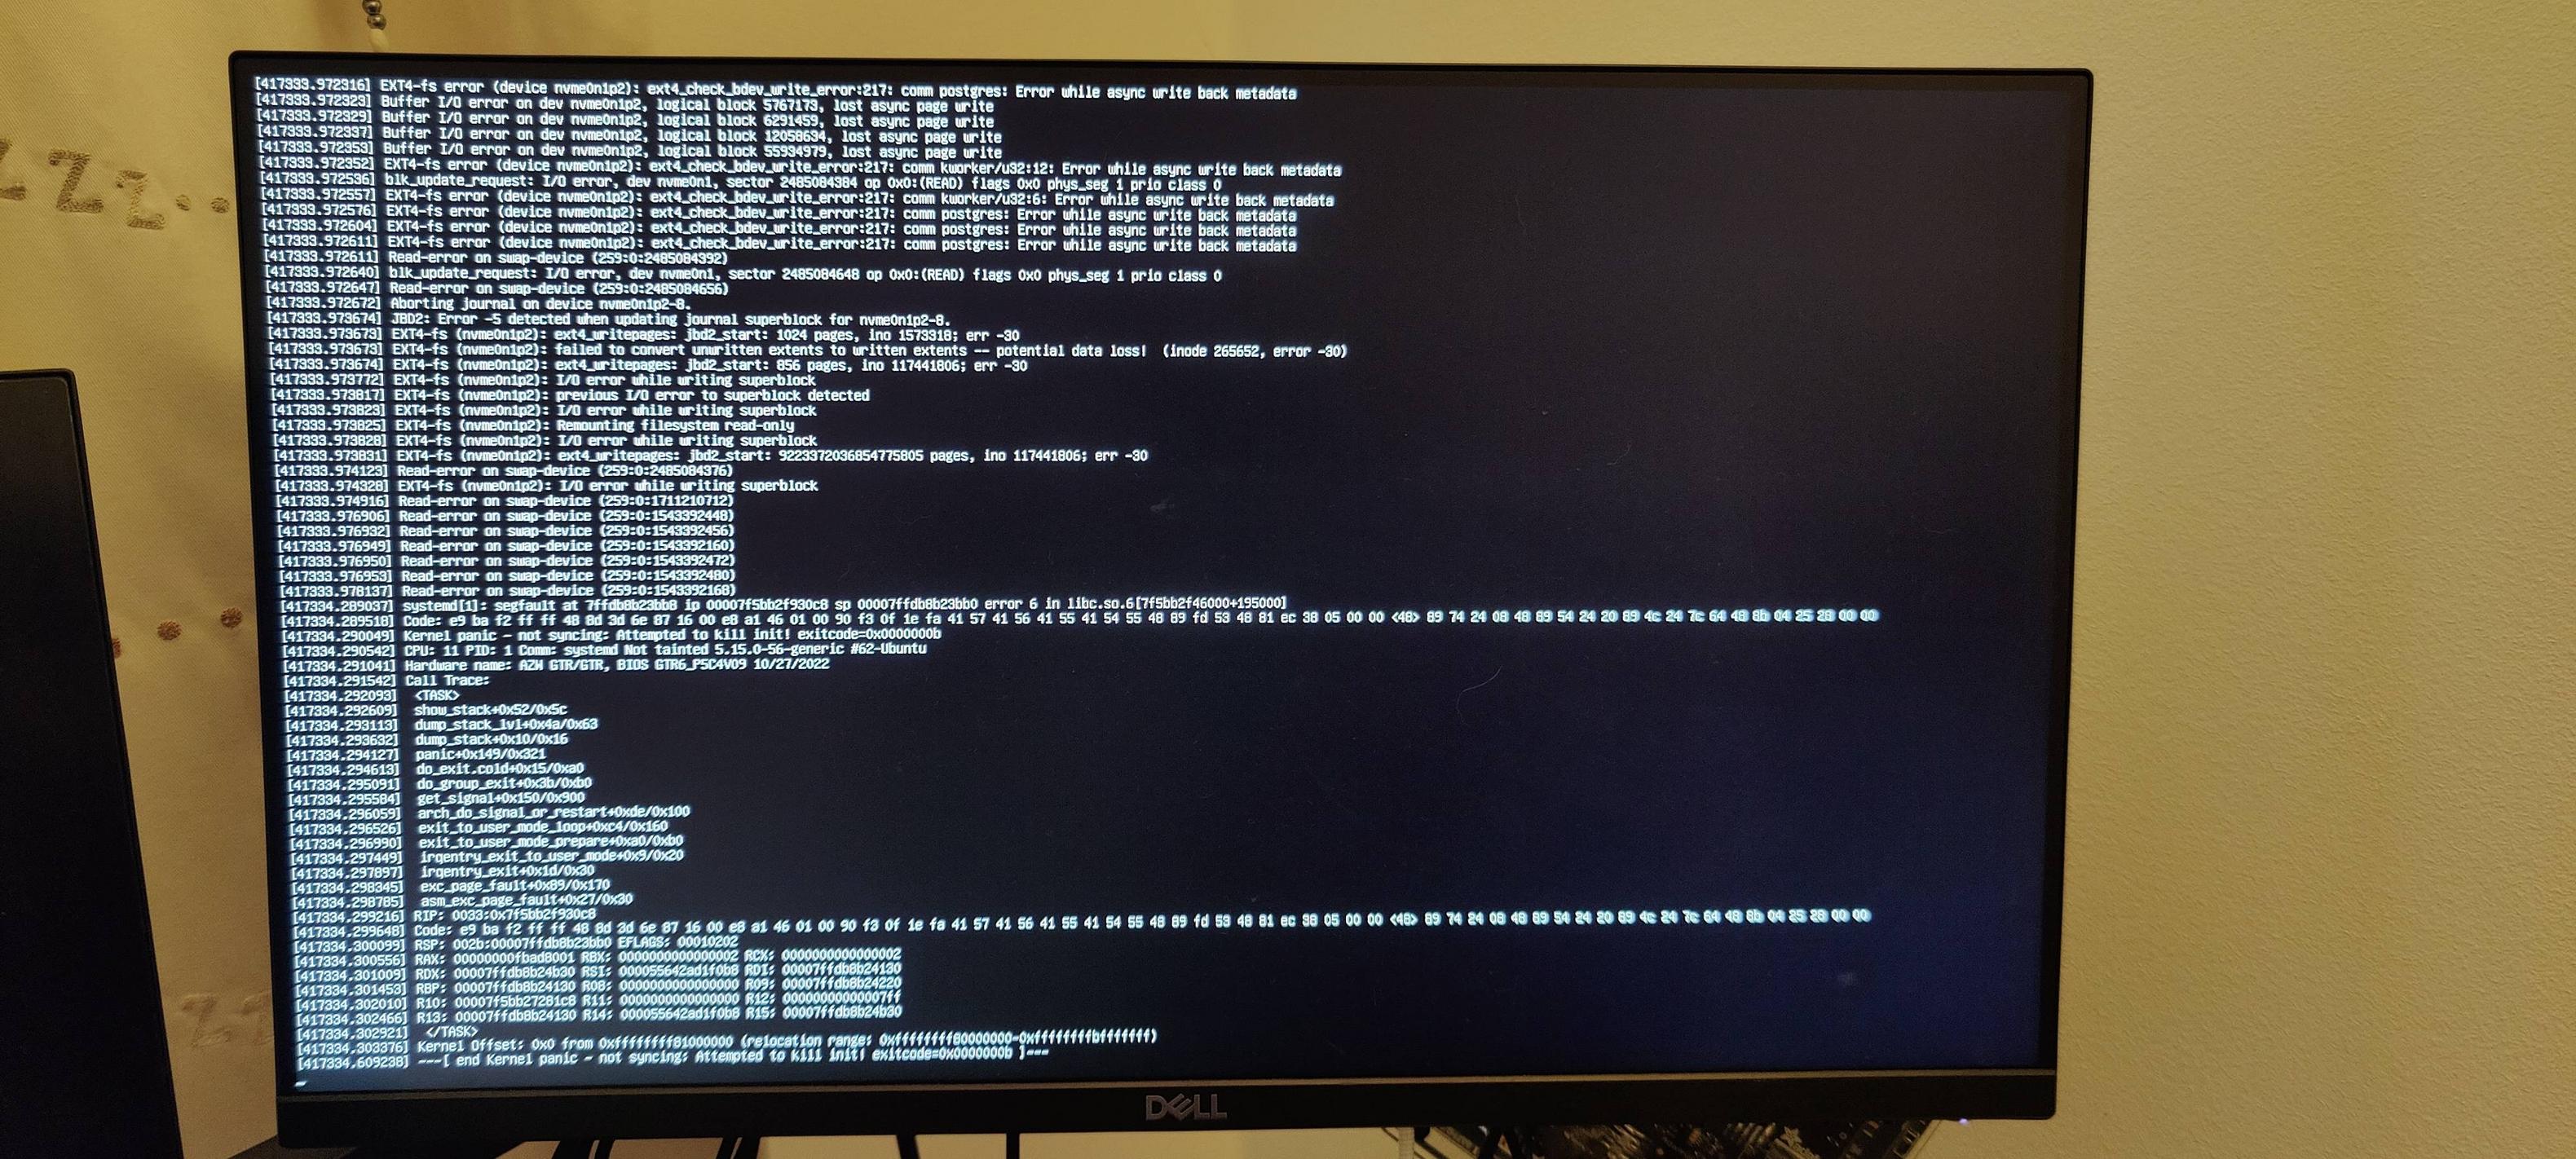
I have reached out to support and their initial suggestion along with a bunch of questions was whether I had tried to reinstall the OS. I've given this a go too, formatting the drive and reinstalling the OS (Ubuntu Server 22 LTS).
After that, the issue hadn't happened for 4 days before it finally showed itself as a kernel panic:
Because of this and trying to check everything I could find, I ran FSCK on boot to see if there was anything obvious - this is quite common after the hard reset:
# cat /run/initramfs/fsck.log
Log of fsck -C -f -y -V -t ext4 /dev/mapper/ubuntu--vg-ubuntu--lv
Fri Dec 30 17:26:21 2022
fsck from util-linux 2.37.2
[/usr/sbin/fsck.ext4 (1) -- /dev/mapper/ubuntu--vg-ubuntu--lv] fsck.ext4 -f -y -C0 /dev/mapper/ubuntu--vg-ubuntu--lv
e2fsck 1.46.5 (30-Dec-2021)
/dev/mapper/ubuntu--vg-ubuntu--lv: recovering journal
Clearing orphaned inode 524449 (uid=1000, gid=1000, mode=0100664, size=6216)
Pass 1: Checking inodes, blocks, and sizes
Inode 6947190 extent tree (at level 1) could be shorter. Optimize? yes
Inode 6947197 extent tree (at level 1) could be shorter. Optimize? yes
Inode 6947204 extent tree (at level 1) could be shorter. Optimize? yes
Inode 6947212 extent tree (at level 1) could be shorter. Optimize? yes
Inode 6947408 extent tree (at level 1) could be shorter. Optimize? yes
Inode 6947414 extent tree (at level 1) could be shorter. Optimize? yes
Inode 6947829 extent tree (at level 1) could be shorter. Optimize? yes
Inode 6947835 extent tree (at level 1) could be shorter. Optimize? yes
Inode 6947841 extent tree (at level 1) could be shorter. Optimize? yes
Pass 1E: Optimizing extent trees
Pass 2: Checking directory structure
Pass 3: Checking directory connectivity
Pass 4: Checking reference counts
Pass 5: Checking group summary information
Free blocks count wrong (401572584, counted=405399533).
Fix? yes
Free inodes count wrong (121360470, counted=121358242).
Fix? yes
/dev/mapper/ubuntu--vg-ubuntu--lv: ***** FILE SYSTEM WAS MODIFIED *****
/dev/mapper/ubuntu--vg-ubuntu--lv: 538718/121896960 files (0.2% non-contiguous), 82178067/487577600 blocks
fsck exited with status code 1
Fri Dec 30 17:26:25 2022
----------------
Running smart-log doesn't seem to show anything concerning, other than the number of unsafe shutdowns (the number of times this has happened so far)...
# nvme smart-log /dev/nvme0
Smart Log for NVME device:nvme0 namespace-id:ffffffff
critical_warning : 0
temperature : 32 C (305 Kelvin)
available_spare : 100%
available_spare_threshold : 10%
percentage_used : 0%
endurance group critical warning summary: 0
data_units_read : 8,544,896
data_units_written : 5,175,904
host_read_commands : 39,050,379
host_write_commands : 191,366,905
controller_busy_time : 1,069
power_cycles : 21
power_on_hours : 142
unsafe_shutdowns : 12
media_errors : 0
num_err_log_entries : 0
Warning Temperature Time : 0
Critical Composite Temperature Time : 0
Temperature Sensor 1 : 32 C (305 Kelvin)
Temperature Sensor 2 : 36 C (309 Kelvin)
Thermal Management T1 Trans Count : 0
Thermal Management T2 Trans Count : 0
Thermal Management T1 Total Time : 0
Thermal Management T2 Total Time : 0
I have reached out to support and their initial suggestion along with a bunch of questions was whether I had tried to reinstall the OS. I've given this a go too, formatting the drive and reinstalling the OS (Ubuntu Server 22 LTS).
After that, the issue hadn't happened for 4 days before it finally showed itself as a kernel panic:
 Any ideas what I can do to identify if the problem is with the SSD itself or the hardware that the SSD is slotted into (the GTR6)? I have until the 31st to return the SSD, so would love to pin down the most likely cause of the issue sooner rather than later...
I'm even more concerned after seeing reports that others are having serious health issues with the Samsung 990 Pro:
https://www.reddit.com/r/hardware/comments/10jkwwh/samsung_990_pro_ssd_with_rapid_health_drops/
Edit: although I realised those reported issues are with the 990 pro, not the 980 pro that I have!
Edit2: someone in overclockers was kind enough to suggest hd sentinel, which does show a health metric, which seems ok:
# ./hdsentinel-019c-x64
Hard Disk Sentinel for LINUX console 0.19c.9986 (c) 2021 info@hdsentinel.com
Start with -r [reportfile] to save data to report, -h for help
Examining hard disk configuration ...
HDD Device 0: /dev/nvme0
HDD Model ID : Samsung SSD 980 PRO 2TB
HDD Serial No: S69ENL0T905031A
HDD Revision : 5B2QGXA7
HDD Size : 1907729 MB
Interface : NVMe
Temperature : 41 °C
Highest Temp.: 41 °C
Health : 99 %
Performance : 100 %
Power on time: 21 days, 12 hours
Est. lifetime: more than 1000 days
Total written: 8.30 TB
The status of the solid state disk is PERFECT. Problematic or weak sectors were not found.
The health is determined by SSD specific S.M.A.R.T. attribute(s): Available Spare (Percent), Percentage Used
No actions needed.
Lastly, none of the things I tried such as the smart-log seem to show something like a health metric. How can I check this in ubuntu?
Thanks!
Any ideas what I can do to identify if the problem is with the SSD itself or the hardware that the SSD is slotted into (the GTR6)? I have until the 31st to return the SSD, so would love to pin down the most likely cause of the issue sooner rather than later...
I'm even more concerned after seeing reports that others are having serious health issues with the Samsung 990 Pro:
https://www.reddit.com/r/hardware/comments/10jkwwh/samsung_990_pro_ssd_with_rapid_health_drops/
Edit: although I realised those reported issues are with the 990 pro, not the 980 pro that I have!
Edit2: someone in overclockers was kind enough to suggest hd sentinel, which does show a health metric, which seems ok:
# ./hdsentinel-019c-x64
Hard Disk Sentinel for LINUX console 0.19c.9986 (c) 2021 info@hdsentinel.com
Start with -r [reportfile] to save data to report, -h for help
Examining hard disk configuration ...
HDD Device 0: /dev/nvme0
HDD Model ID : Samsung SSD 980 PRO 2TB
HDD Serial No: S69ENL0T905031A
HDD Revision : 5B2QGXA7
HDD Size : 1907729 MB
Interface : NVMe
Temperature : 41 °C
Highest Temp.: 41 °C
Health : 99 %
Performance : 100 %
Power on time: 21 days, 12 hours
Est. lifetime: more than 1000 days
Total written: 8.30 TB
The status of the solid state disk is PERFECT. Problematic or weak sectors were not found.
The health is determined by SSD specific S.M.A.R.T. attribute(s): Available Spare (Percent), Percentage Used
No actions needed.
Lastly, none of the things I tried such as the smart-log seem to show something like a health metric. How can I check this in ubuntu?
Thanks!
If I'm quick enough, I can still login via SSH but the system becomes increasingly unstable before commands start failing with an I/O error. When I did manage to login, it did seem to think there's no connected NVME SSDs:
Another instance of the buffer I/O error on the nvme slot:
Because of this and trying to check everything I could find, I ran FSCK on boot to see if there was anything obvious - this is quite common after the hard reset:
# cat /run/initramfs/fsck.log
Log of fsck -C -f -y -V -t ext4 /dev/mapper/ubuntu--vg-ubuntu--lv
Fri Dec 30 17:26:21 2022
fsck from util-linux 2.37.2
[/usr/sbin/fsck.ext4 (1) -- /dev/mapper/ubuntu--vg-ubuntu--lv] fsck.ext4 -f -y -C0 /dev/mapper/ubuntu--vg-ubuntu--lv
e2fsck 1.46.5 (30-Dec-2021)
/dev/mapper/ubuntu--vg-ubuntu--lv: recovering journal
Clearing orphaned inode 524449 (uid=1000, gid=1000, mode=0100664, size=6216)
Pass 1: Checking inodes, blocks, and sizes
Inode 6947190 extent tree (at level 1) could be shorter. Optimize? yes
Inode 6947197 extent tree (at level 1) could be shorter. Optimize? yes
Inode 6947204 extent tree (at level 1) could be shorter. Optimize? yes
Inode 6947212 extent tree (at level 1) could be shorter. Optimize? yes
Inode 6947408 extent tree (at level 1) could be shorter. Optimize? yes
Inode 6947414 extent tree (at level 1) could be shorter. Optimize? yes
Inode 6947829 extent tree (at level 1) could be shorter. Optimize? yes
Inode 6947835 extent tree (at level 1) could be shorter. Optimize? yes
Inode 6947841 extent tree (at level 1) could be shorter. Optimize? yes
Pass 1E: Optimizing extent trees
Pass 2: Checking directory structure
Pass 3: Checking directory connectivity
Pass 4: Checking reference counts
Pass 5: Checking group summary information
Free blocks count wrong (401572584, counted=405399533).
Fix? yes
Free inodes count wrong (121360470, counted=121358242).
Fix? yes
/dev/mapper/ubuntu--vg-ubuntu--lv: ***** FILE SYSTEM WAS MODIFIED *****
/dev/mapper/ubuntu--vg-ubuntu--lv: 538718/121896960 files (0.2% non-contiguous), 82178067/487577600 blocks
fsck exited with status code 1
Fri Dec 30 17:26:25 2022
----------------
Running smart-log doesn't seem to show anything concerning, other than the number of unsafe shutdowns (the number of times this has happened so far)...
# nvme smart-log /dev/nvme0
Smart Log for NVME device:nvme0 namespace-id:ffffffff
critical_warning : 0
temperature : 32 C (305 Kelvin)
available_spare : 100%
available_spare_threshold : 10%
percentage_used : 0%
endurance group critical warning summary: 0
data_units_read : 8,544,896
data_units_written : 5,175,904
host_read_commands : 39,050,379
host_write_commands : 191,366,905
controller_busy_time : 1,069
power_cycles : 21
power_on_hours : 142
unsafe_shutdowns : 12
media_errors : 0
num_err_log_entries : 0
Warning Temperature Time : 0
Critical Composite Temperature Time : 0
Temperature Sensor 1 : 32 C (305 Kelvin)
Temperature Sensor 2 : 36 C (309 Kelvin)
Thermal Management T1 Trans Count : 0
Thermal Management T2 Trans Count : 0
Thermal Management T1 Total Time : 0
Thermal Management T2 Total Time : 0
I have reached out to support and their initial suggestion along with a bunch of questions was whether I had tried to reinstall the OS. I've given this a go too, formatting the drive and reinstalling the OS (Ubuntu Server 22 LTS).
After that, the issue hadn't happened for 4 days before it finally showed itself as a kernel panic:
Any ideas what I can do to identify if the problem is with the SSD itself or the hardware that the SSD is slotted into (the GTR6)? I have until the 31st to return the SSD, so would love to pin down the most likely cause of the issue sooner rather than later...
I'm even more concerned after seeing reports that others are having serious health issues with the Samsung 990 Pro:
https://www.reddit.com/r/hardware/comments/10jkwwh/samsung_990_pro_ssd_with_rapid_health_drops/
Edit: although I realised those reported issues are with the 990 pro, not the 980 pro that I have!
Edit2: someone in overclockers was kind enough to suggest hd sentinel, which does show a health metric, which seems ok:
# ./hdsentinel-019c-x64
Hard Disk Sentinel for LINUX console 0.19c.9986 (c) 2021 info@hdsentinel.com
Start with -r [reportfile] to save data to report, -h for help
Examining hard disk configuration ...
HDD Device 0: /dev/nvme0
HDD Model ID : Samsung SSD 980 PRO 2TB
HDD Serial No: S69ENL0T905031A
HDD Revision : 5B2QGXA7
HDD Size : 1907729 MB
Interface : NVMe
Temperature : 41 °C
Highest Temp.: 41 °C
Health : 99 %
Performance : 100 %
Power on time: 21 days, 12 hours
Est. lifetime: more than 1000 days
Total written: 8.30 TB
The status of the solid state disk is PERFECT. Problematic or weak sectors were not found.
The health is determined by SSD specific S.M.A.R.T. attribute(s): Available Spare (Percent), Percentage Used
No actions needed.
Lastly, none of the things I tried such as the smart-log seem to show something like a health metric. How can I check this in ubuntu?
Thanks!
Asked by Tiago
(101 rep)
Jan 26, 2023, 10:57 AM
Last activity: Jul 18, 2025, 09:03 AM
Last activity: Jul 18, 2025, 09:03 AM